Decode ISOs, utilities and market policy impacting new projects


Research Director, Enverus Intelligence® Research
90% of projects are suspended or withdrawn from the interconnection queue, developers require robust data to effectively assess risks and seize opportunities.
After delving into the intricacies of the 2025 interconnection queue, enhance your project siting strategies by accessing our e-book on project siting.
This guide provides detailed methodologies and tools for identifying optimal parcels for renewable development quickly and efficiently, improving your project’s likelihood of progressing through the queue.
Enverus offers detailed insights into the entire energy asset lifecycle and helps customers achieve 2.5x higher interconnection queue approval rates.
To continue building on the knowledge from the Interconnection Queue Outlook and to further elevate your project’s success, checkout our Project Siting Playbook.
Enverus Intelligence® | Research, Inc. (EIR) is a subsidiary of Enverus that publishes energy-sector research focused on the oil, natural gas and power and renewable industries. EIR publishes reports including asset and company valuations, resource assessments, technical evaluations and macro-economic forecasts and helps make intelligent connections for energy industry participants, service companies and capital providers worldwide.
Enverus is the leading energy-focused software company globally, serving more than 6,000 businesses, including more than 1,000 players in the electric power markets. Each day, more than 7,500 users rely on our platform to drive decision-making in project development, grid management, power trading and asset management. Our advanced data integration sets us apart, transforming complex and scattered datasets into the most detailed, analytics-ready information on power markets.
With a legacy spanning more than 25 years and backed by strategic acquisitions totaling more than $200 million in the power sector, Enverus delivers unmatched insights through a state-of-the-art software platform. Our commitment to innovation is underscored by a $3 billion investment, ensuring we offer the most modern and effective solutions tailored for the energy industry’s dynamics.
ISO Overview
| Type | 2024 Planned Capacity | 2024 New Capacity | 2025 Planned Capacity |
|---|---|---|---|
| Solar | 4.1 GW | 0.37 GW | 1 GW |
| Wind | 1.2 GW | 0.17 GW | 0.13 GW |
| Storage | 1.9 GW | 0.0 GW | 0.45 GW |
Note on “Upcoming Projects With 2025 Operating Dates” graphs: Unlike the graphs showing projects under construction set to complete in 2025 in other regions, there are no qualifying solar, storage, or wind projects in NYISO or BPAT for 2025.
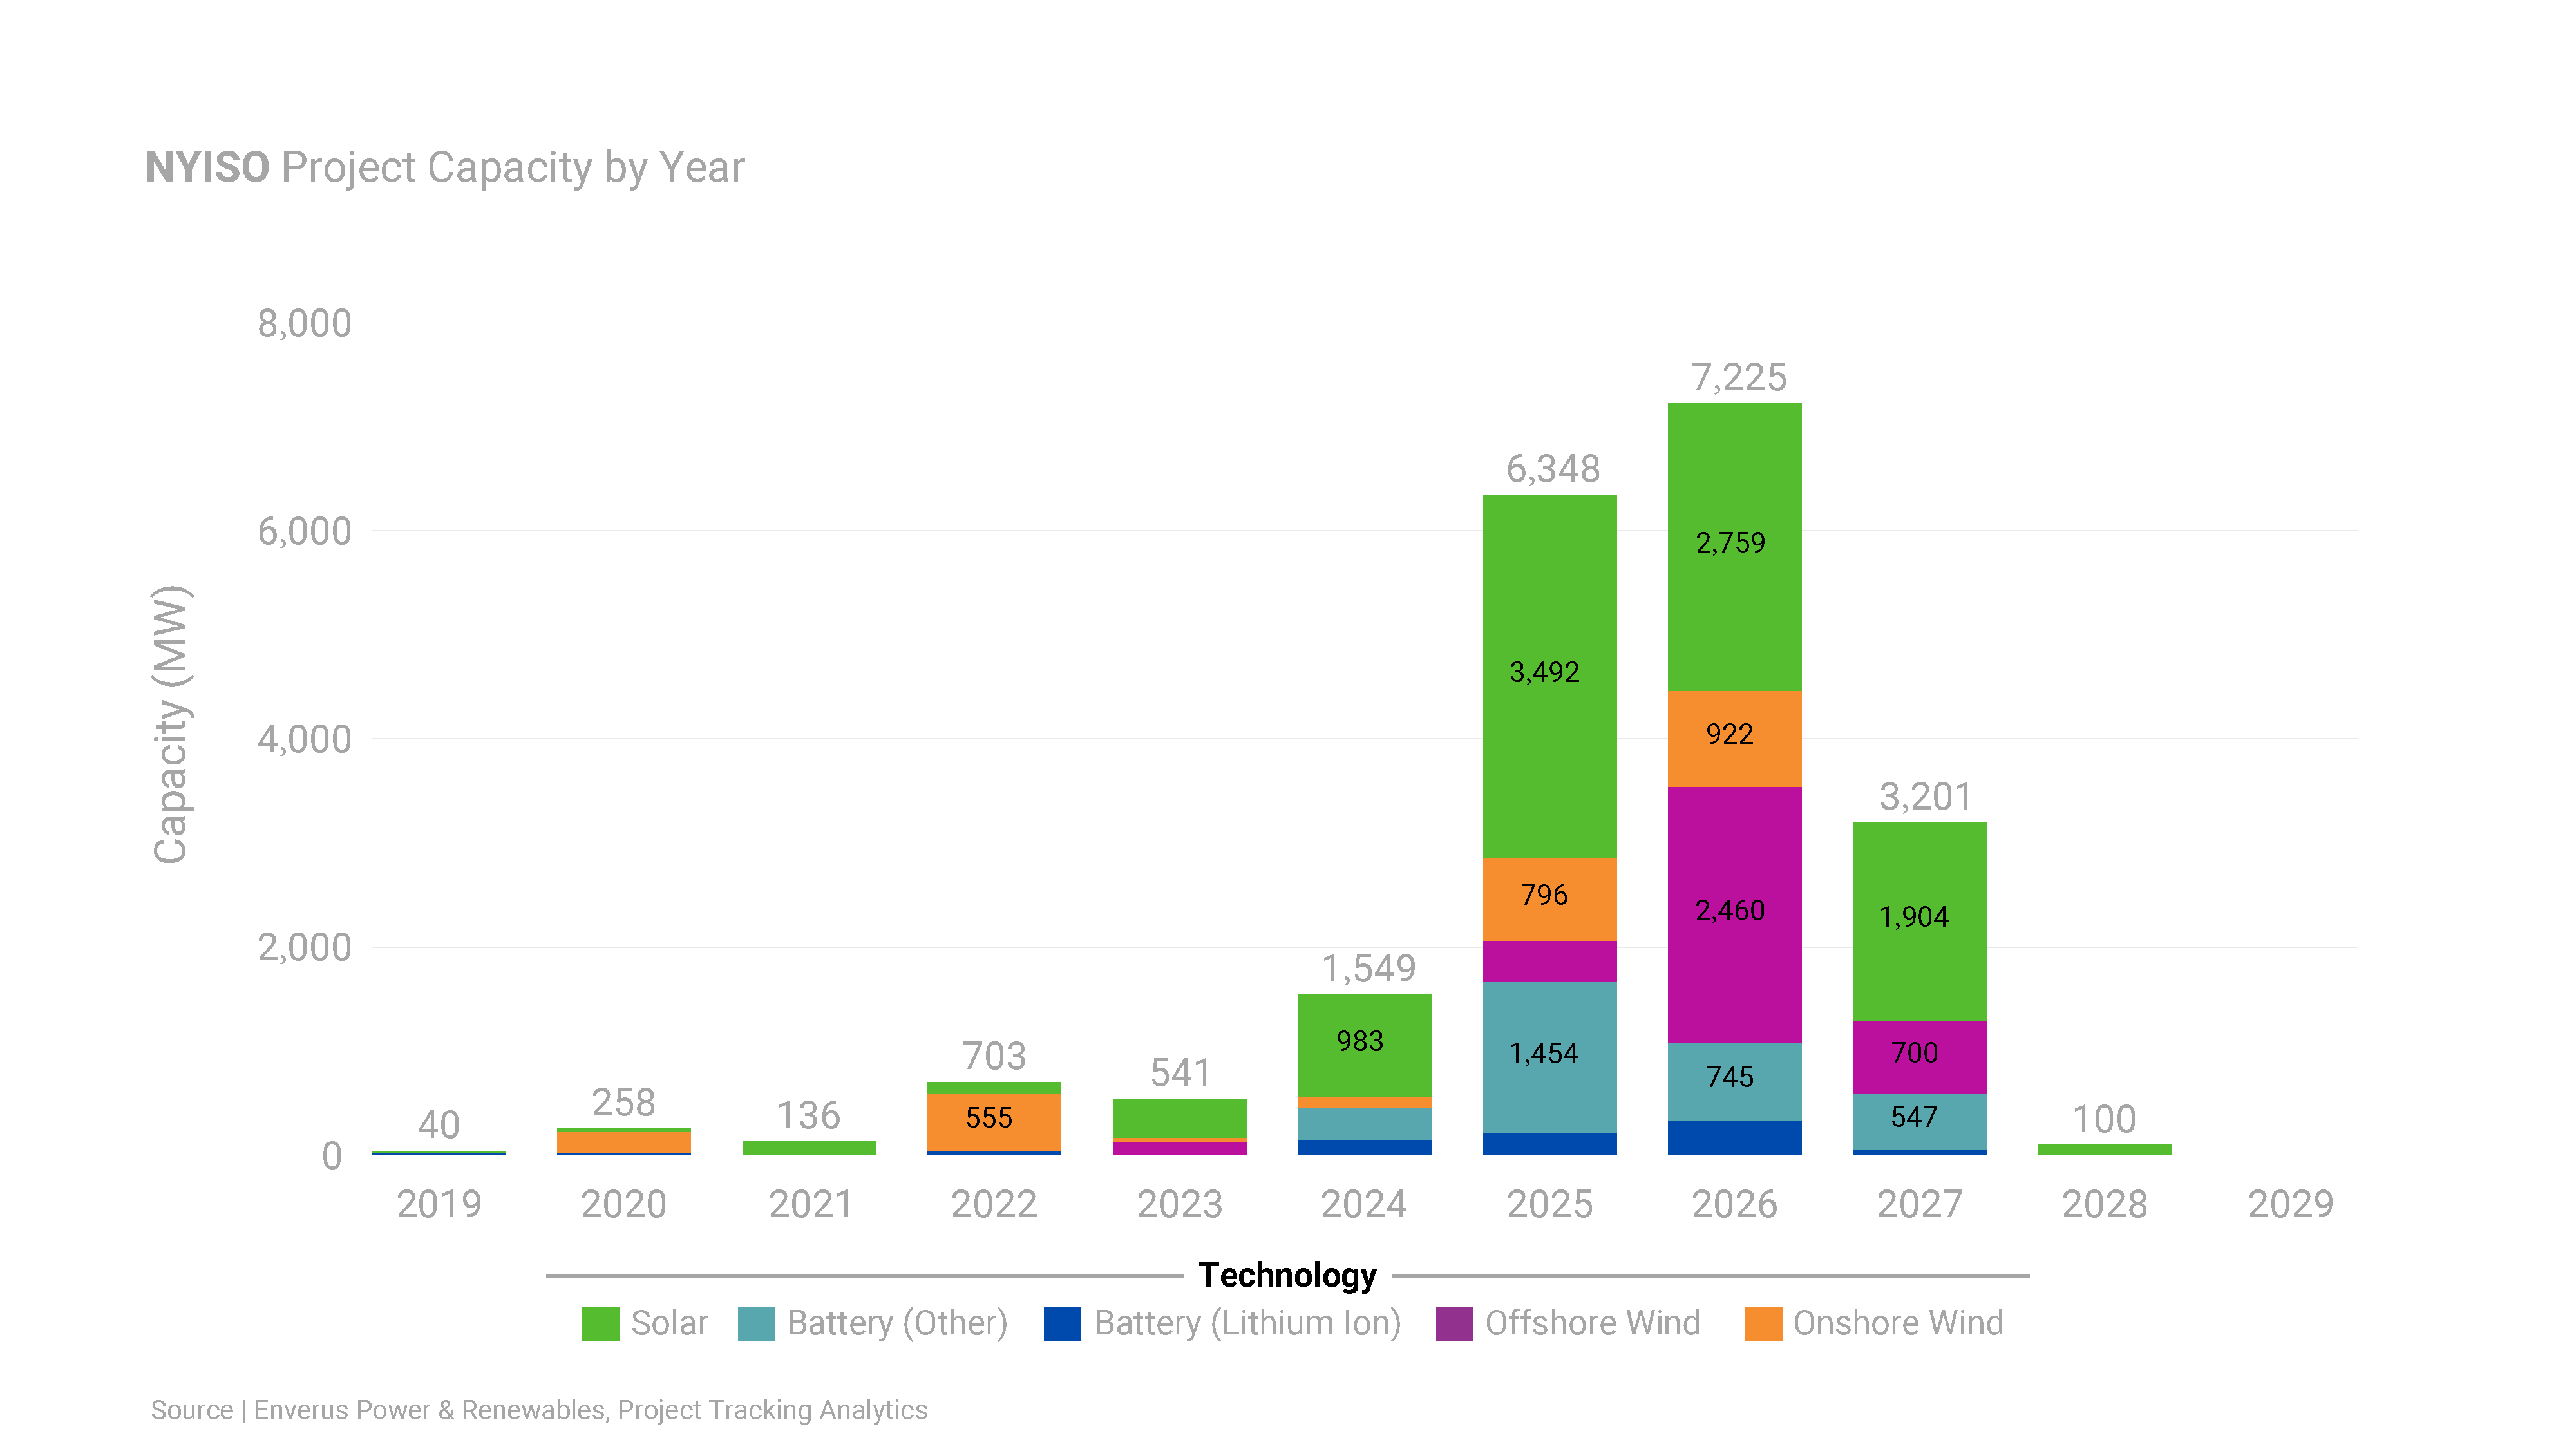
| Type | 2024 Planned Capacity | 2024 New Capacity | 2025 Planned Capacity |
|---|---|---|---|
| Solar | 4.7 GW | 2.44 GW | 3.21 GW |
| Wind | 0.5 GW | 0.0 GW | 0.46 GW |
| Storage | 17.8 GW | 1.94 GW | 9.97 GW |
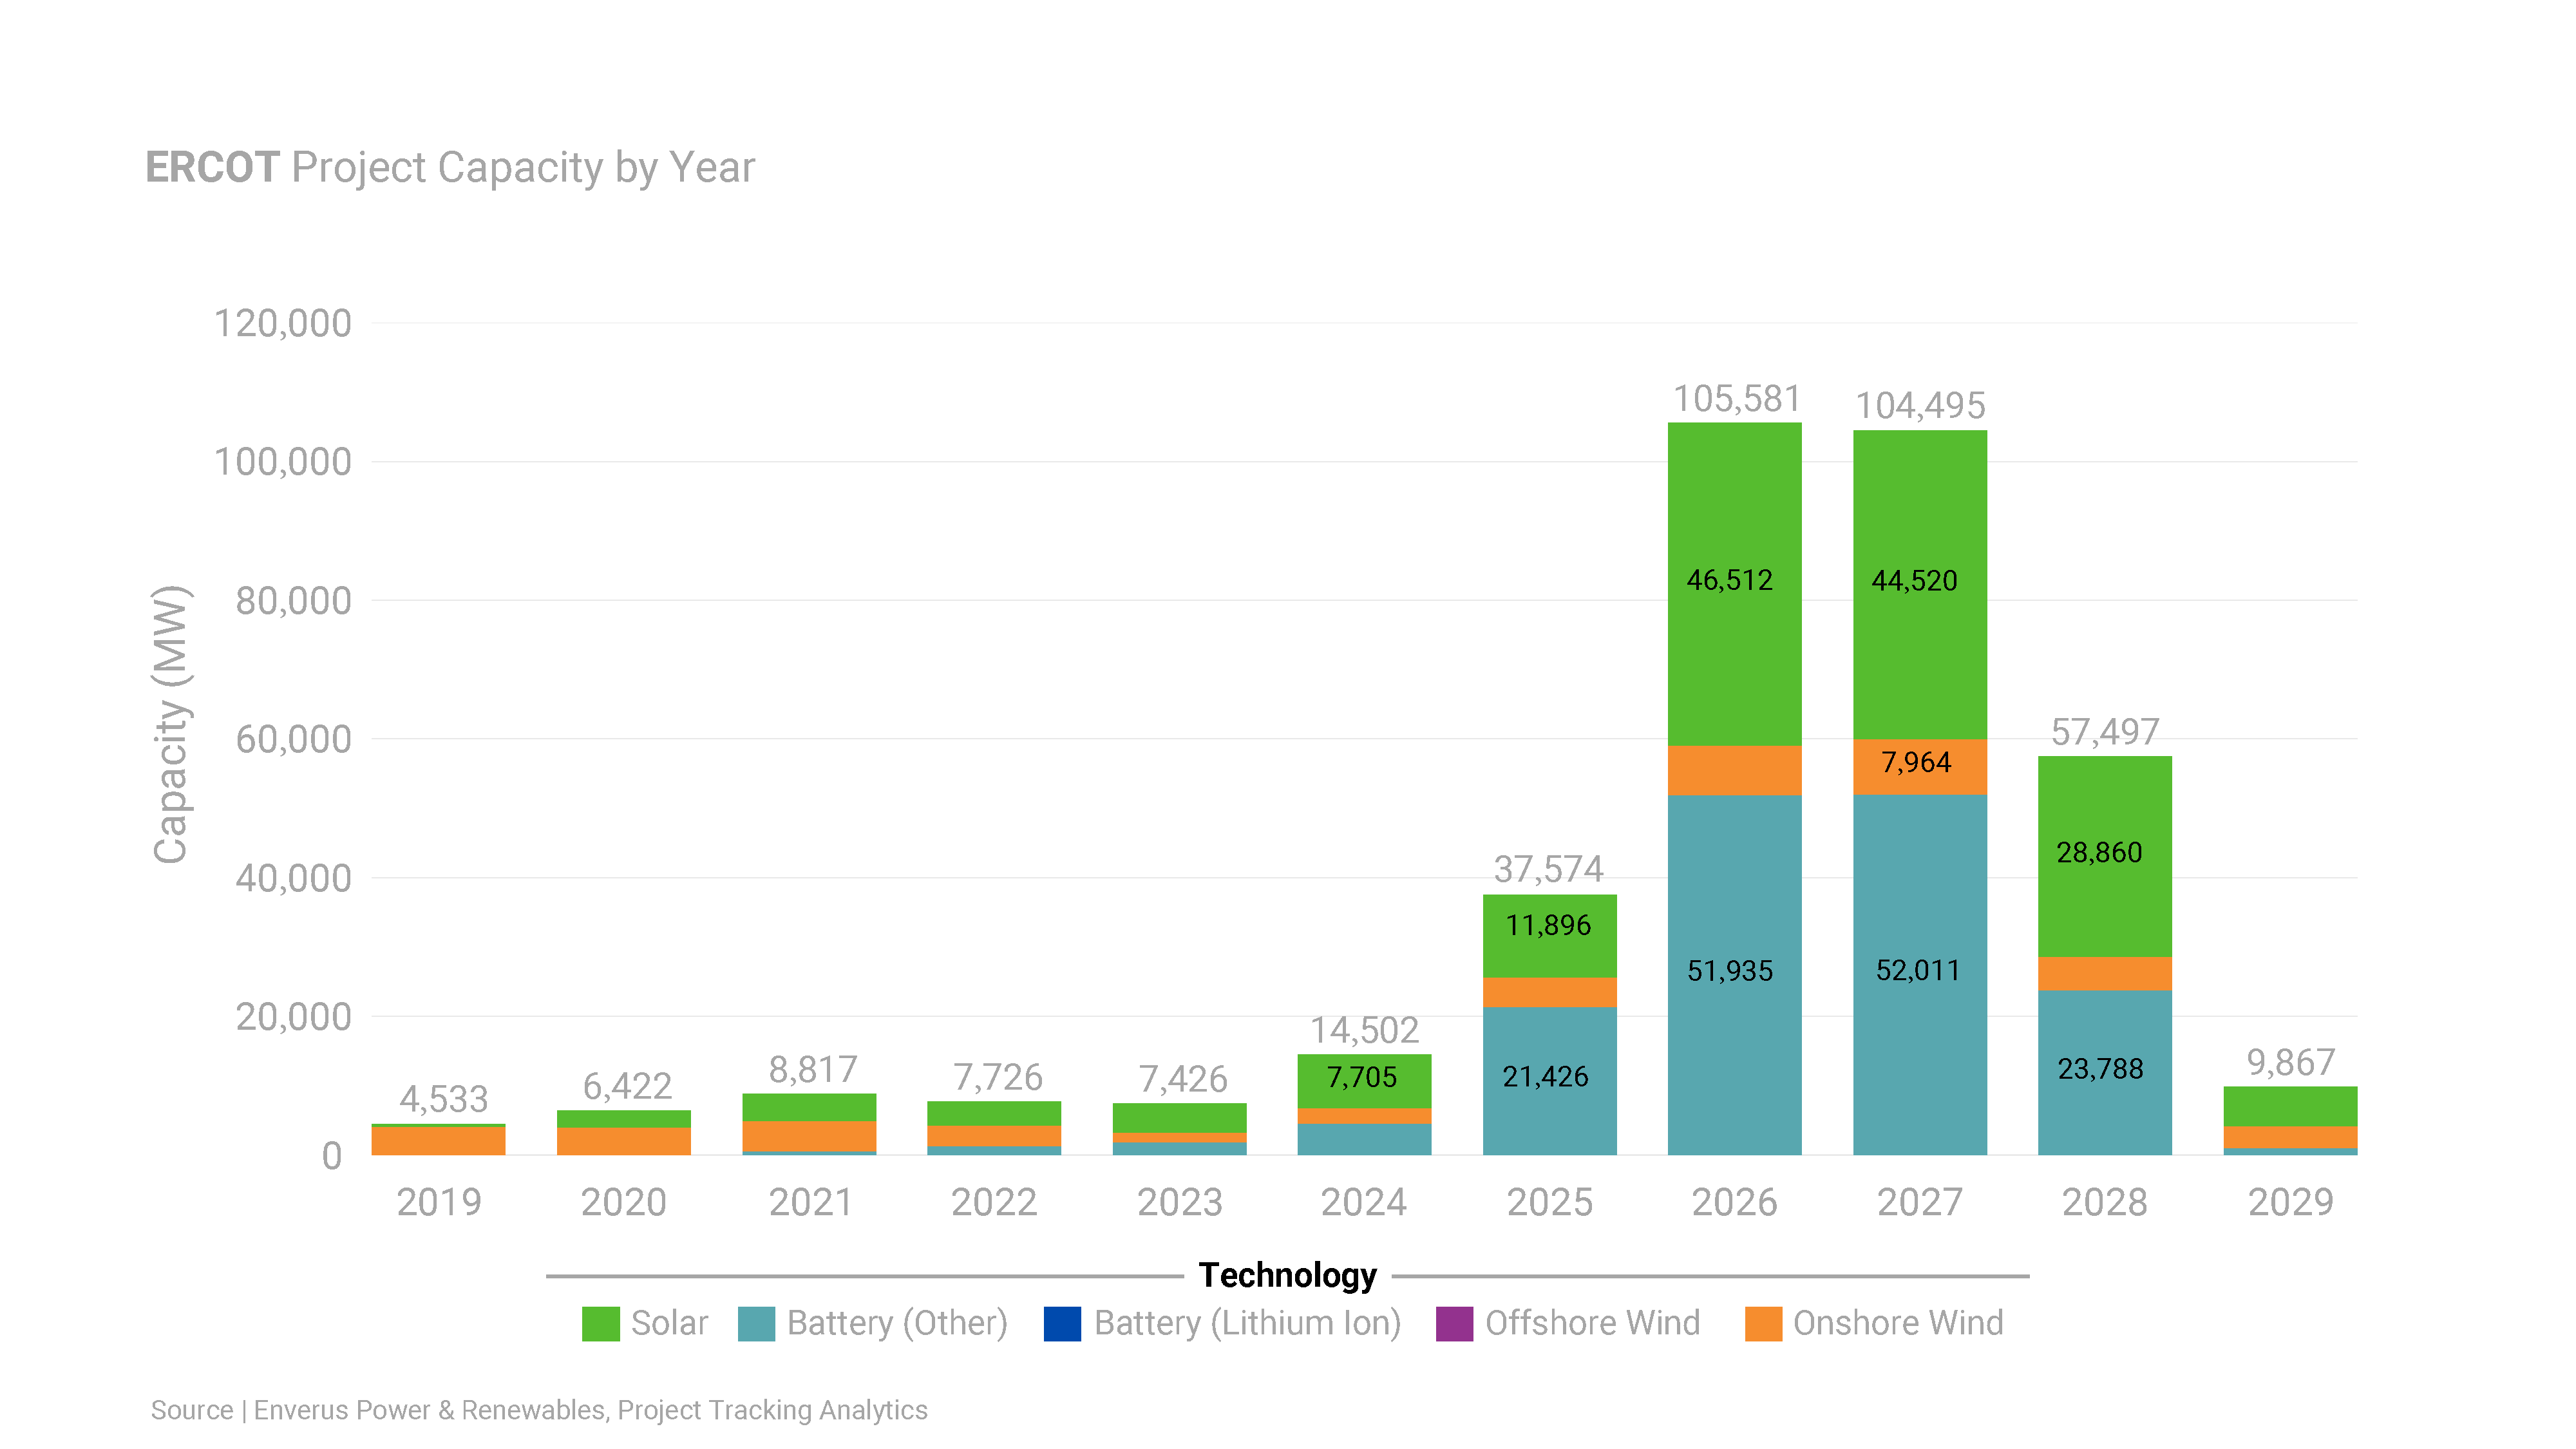
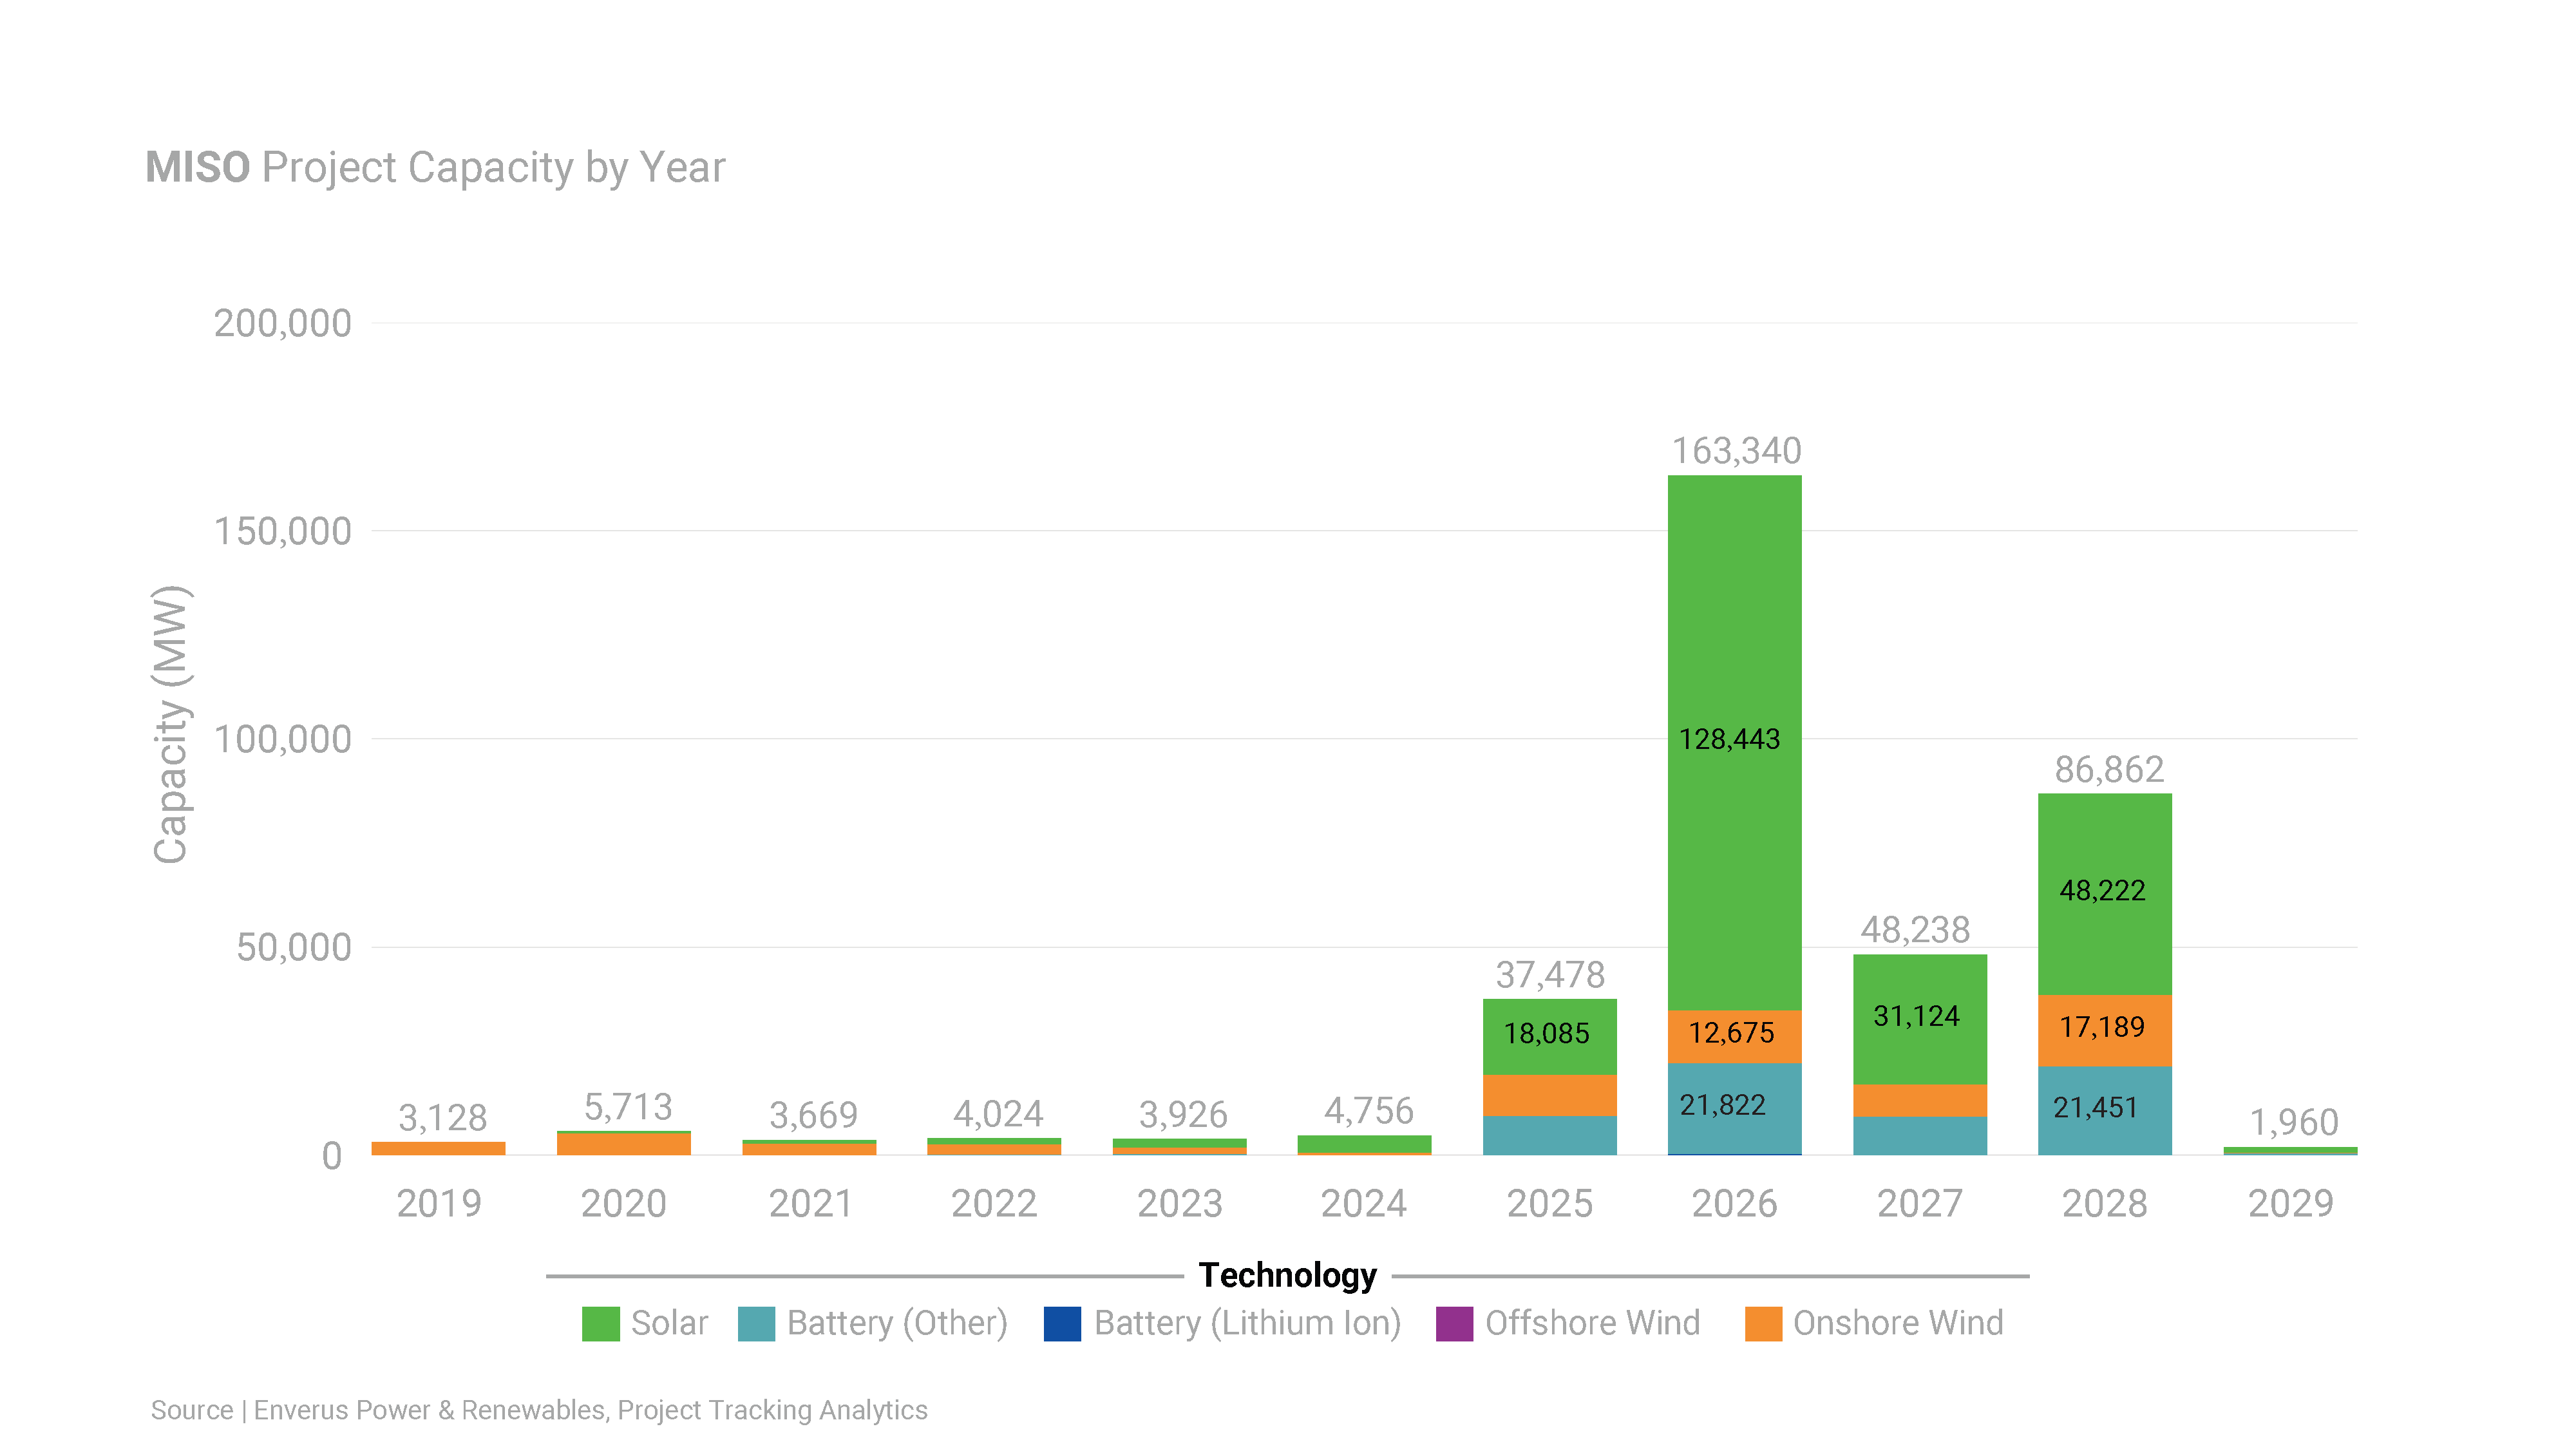
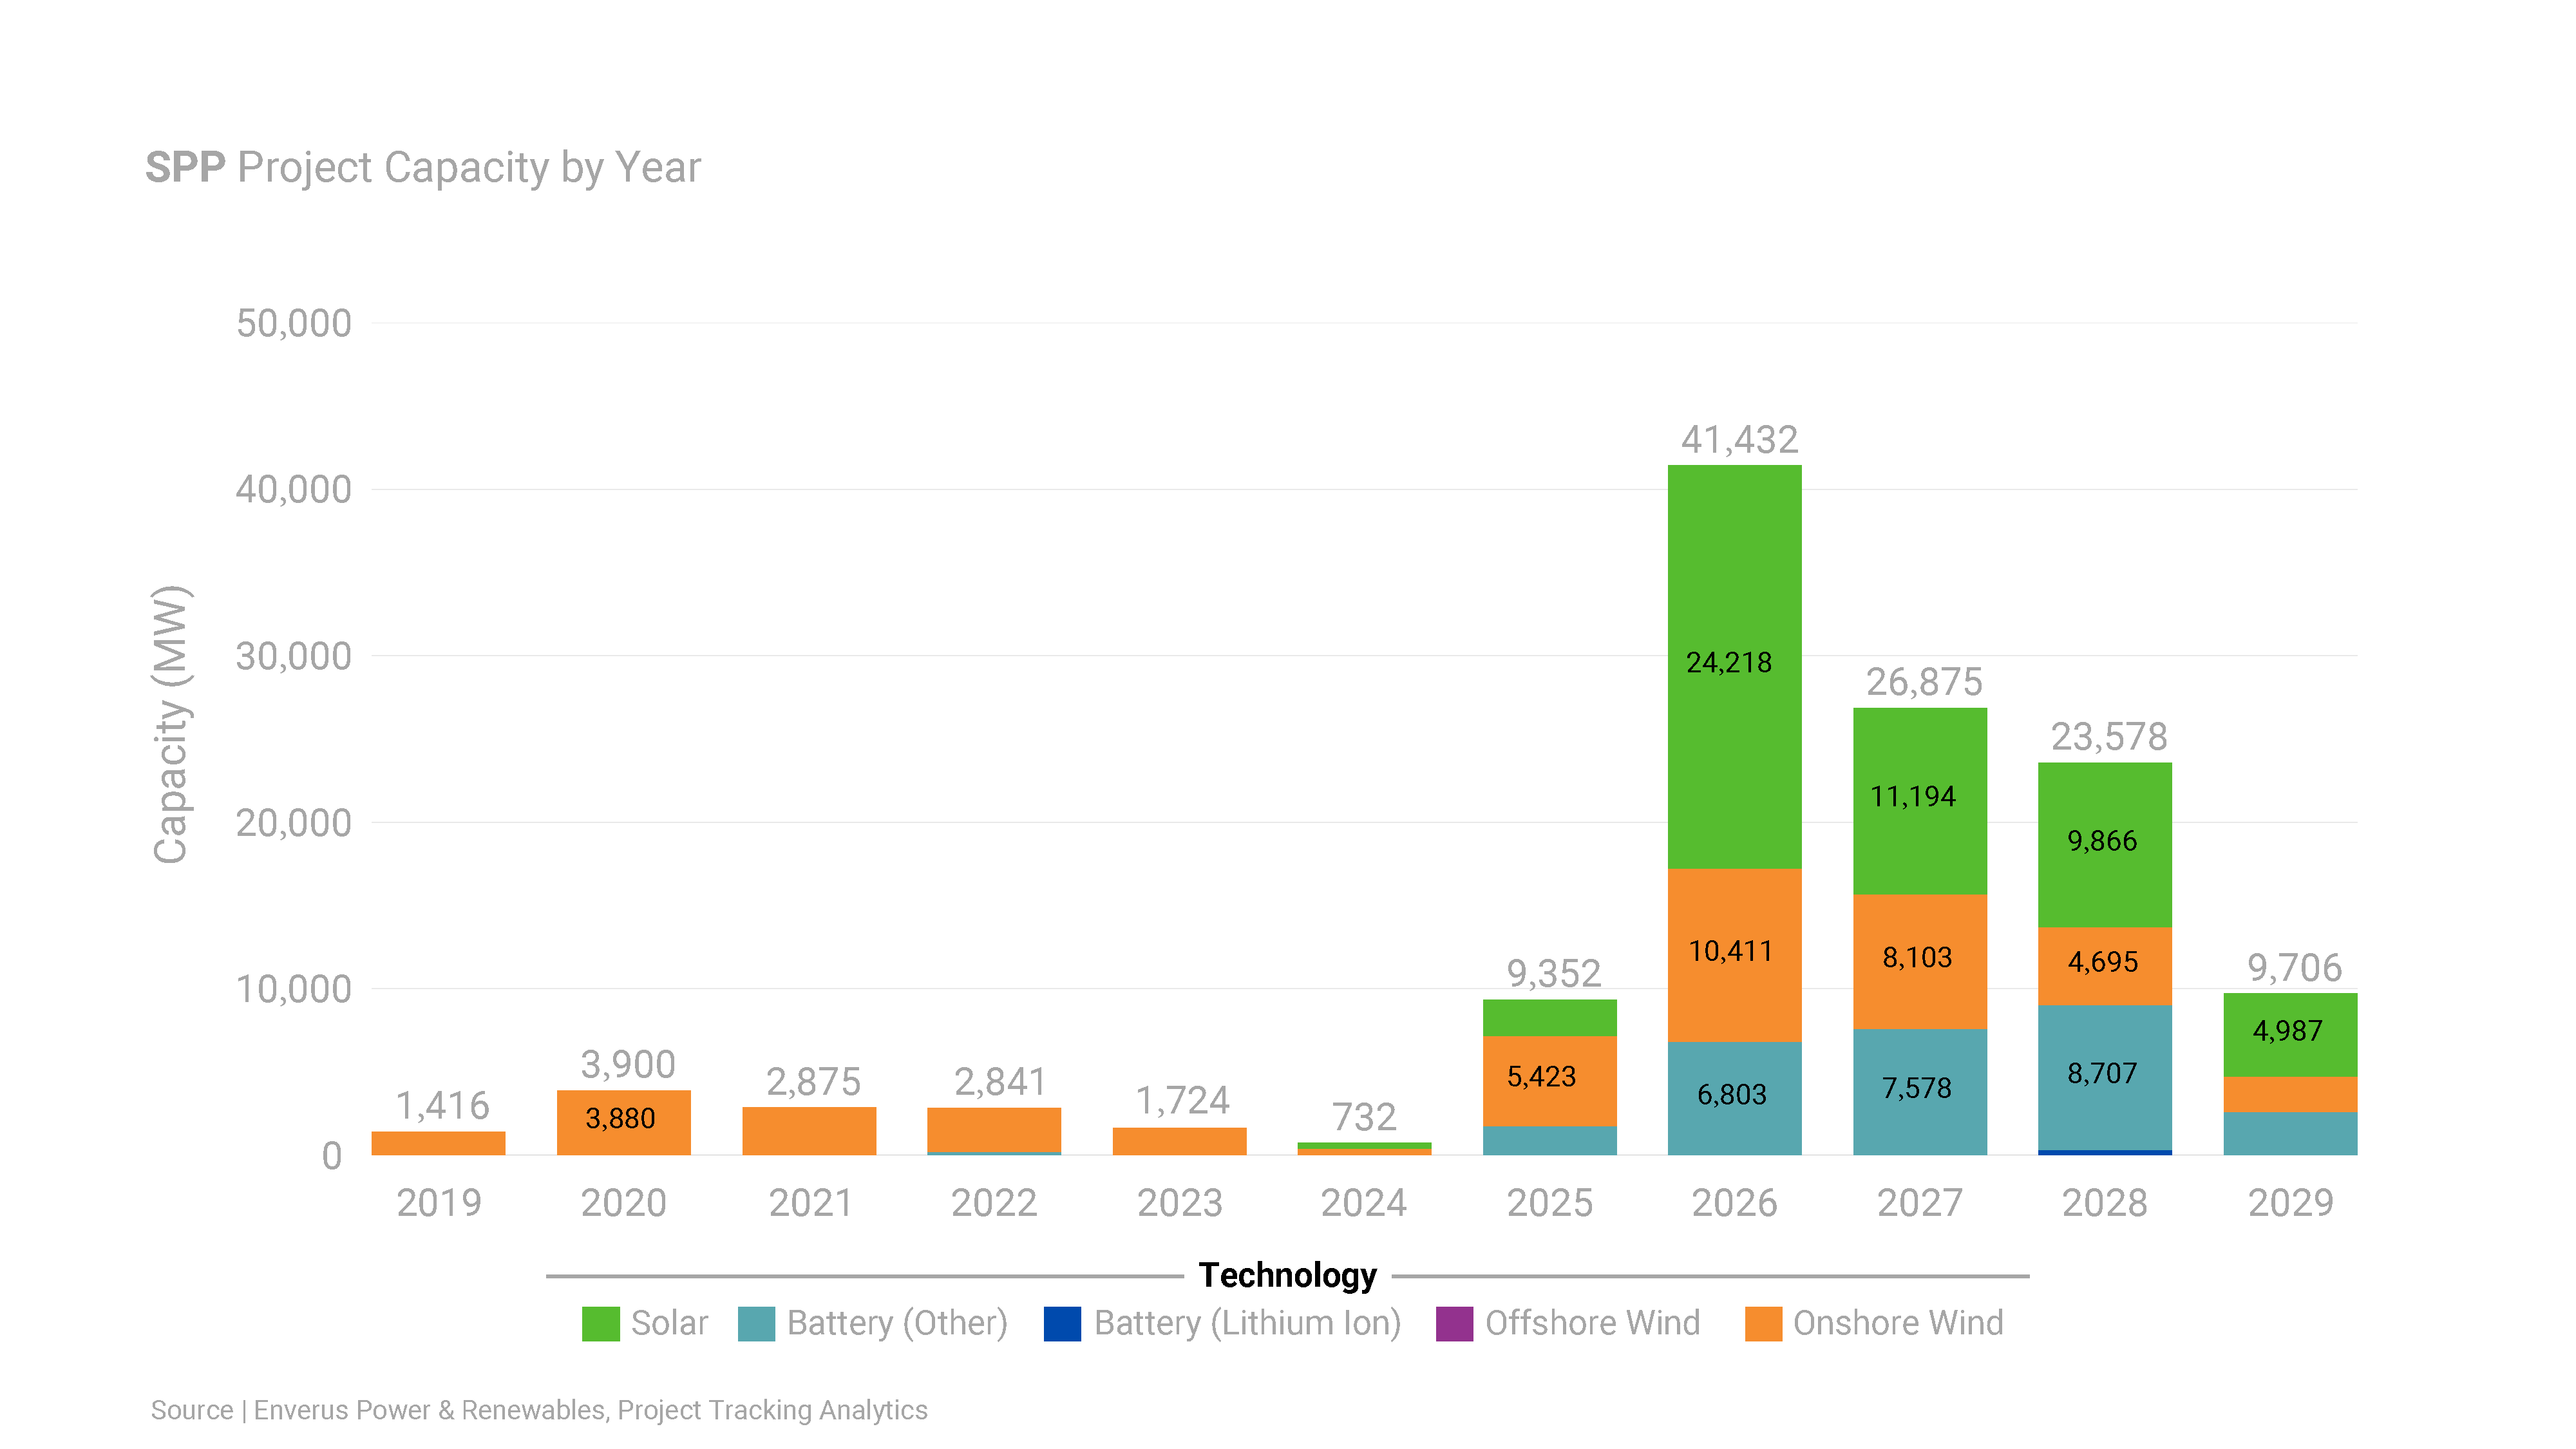
| Type | 2024 Planned Capacity | 2024 New Capacity | 2025 Planned Capacity |
|---|---|---|---|
| Solar | 11 GW | 7.71 GW | 11.9 GW |
| Wind | 4 GW | 2.2 GW | 4.25 GW |
| Storage | 21 GW | 4.59 GW | 21.4 GW |
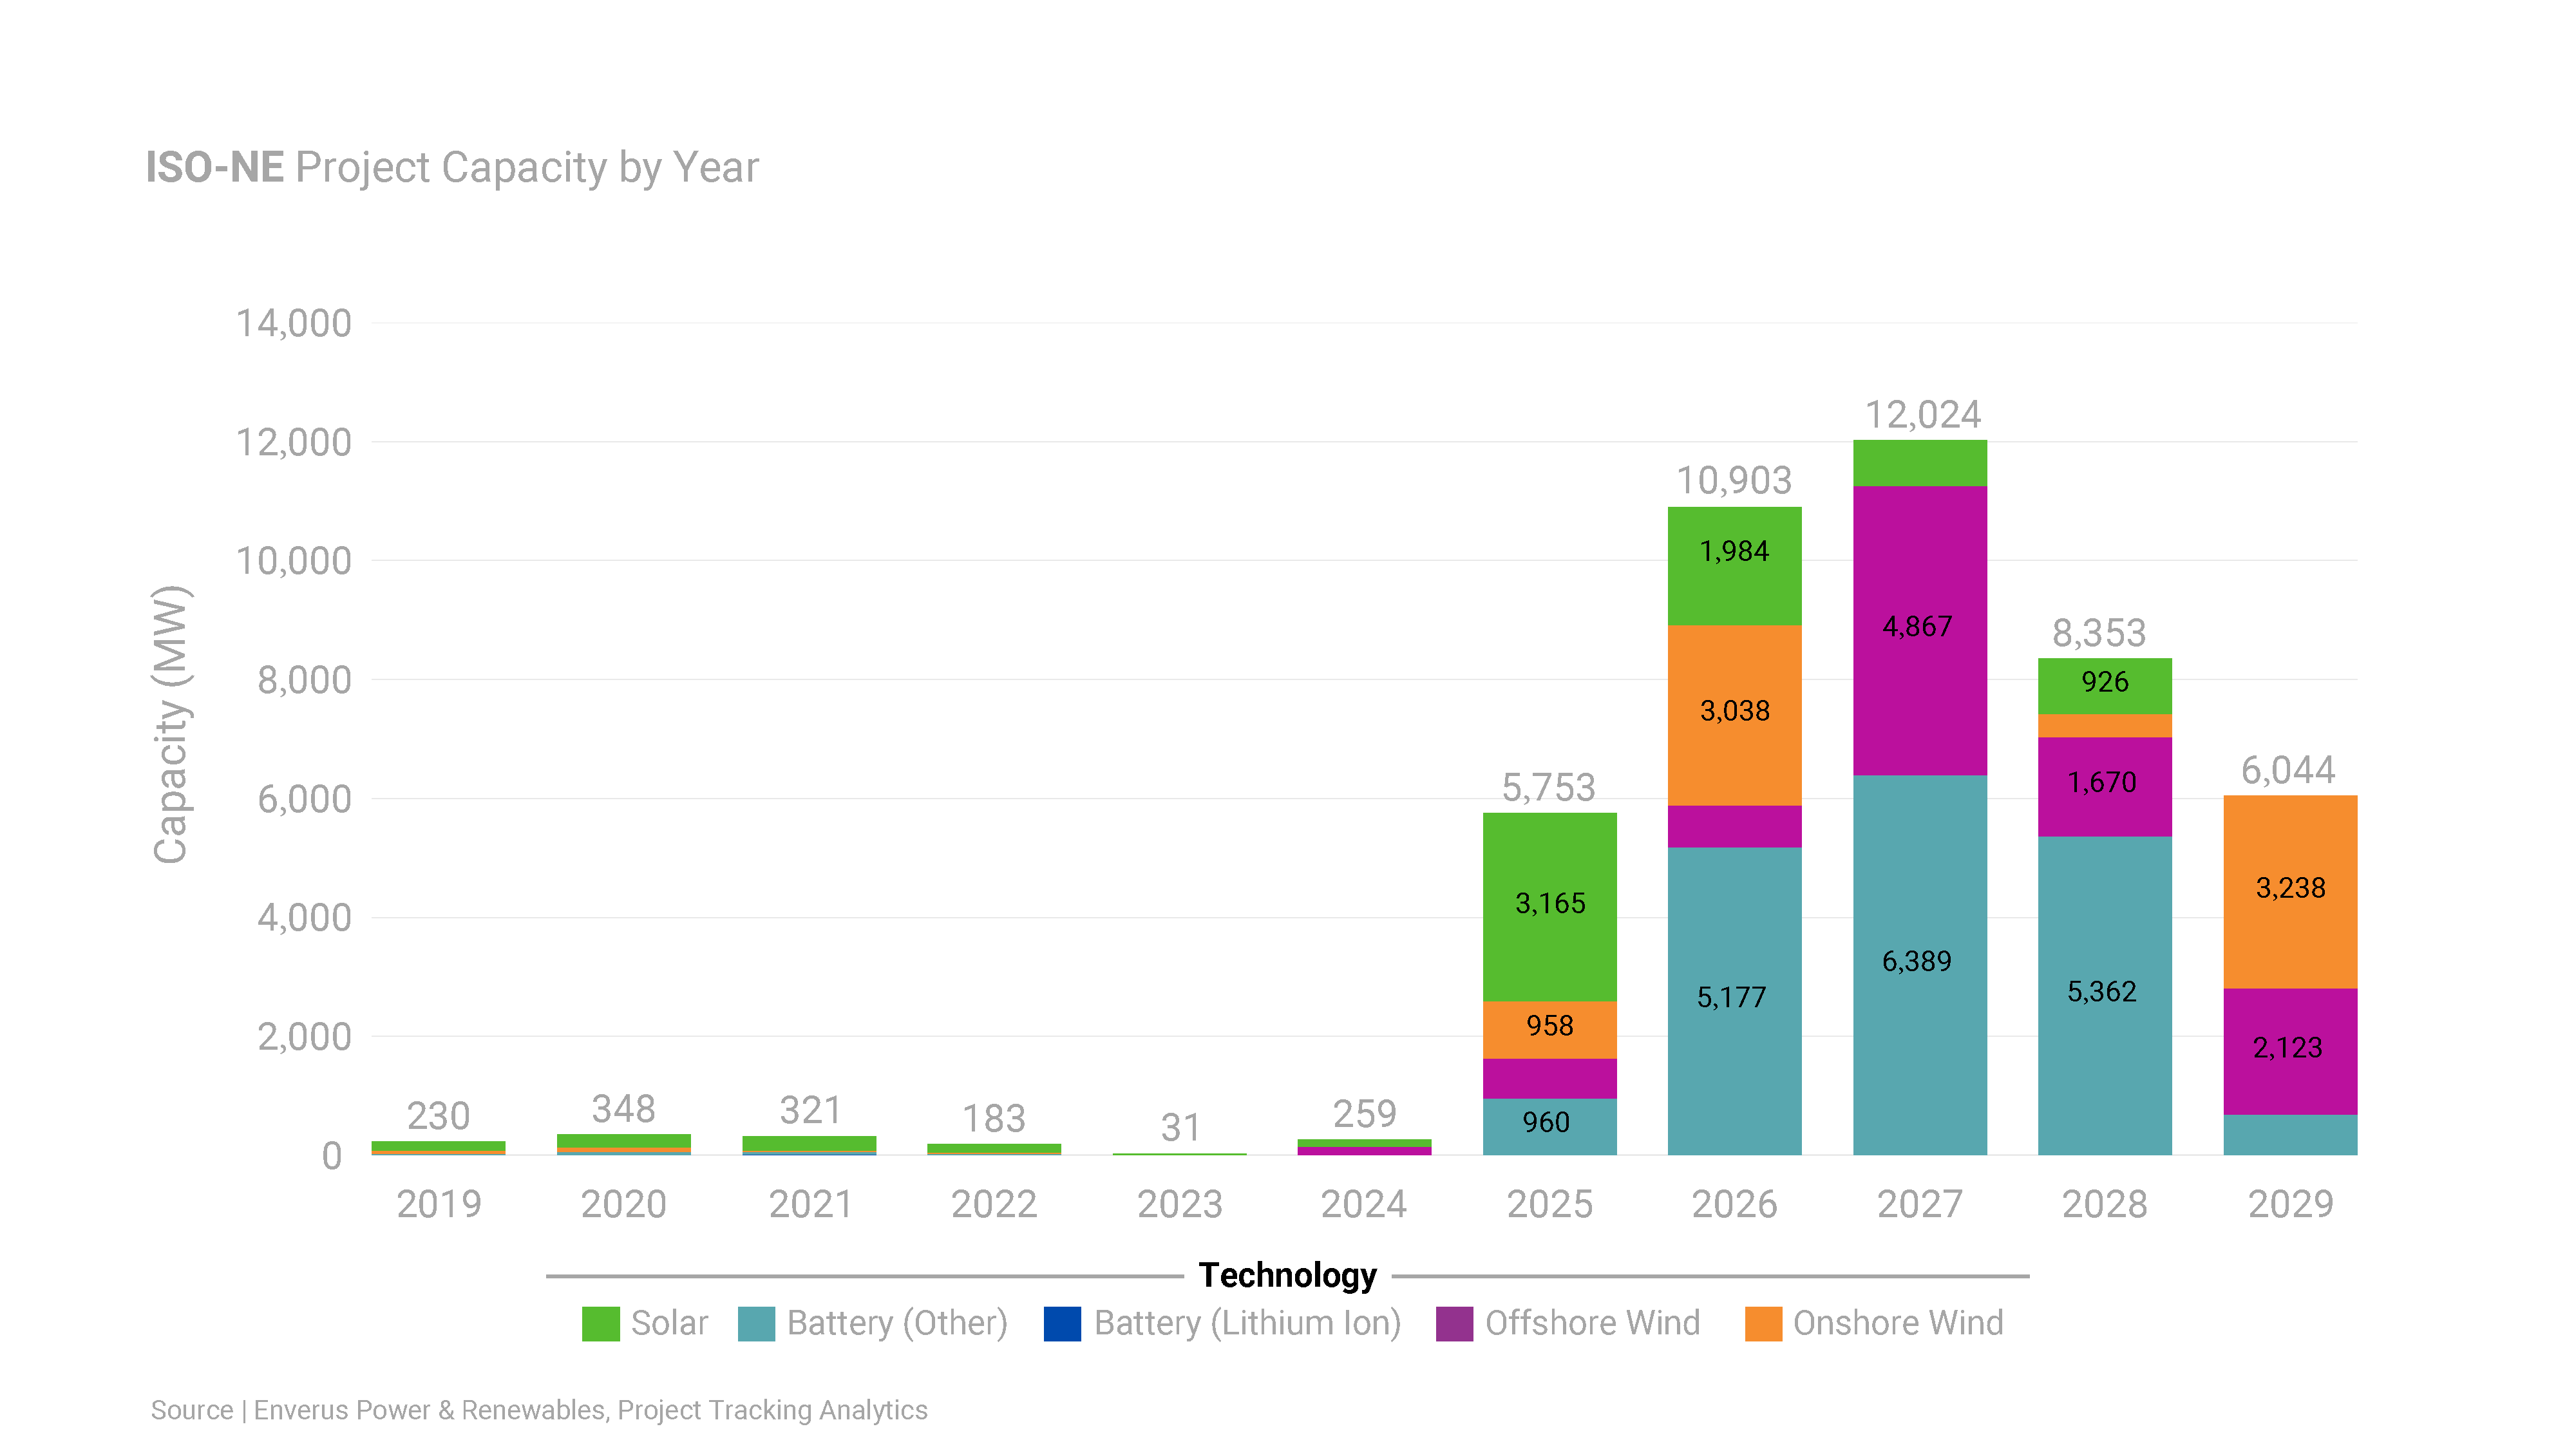
ISO Overview
| Type | 2024 Planned Capacity | 2024 New Capacity | 2025 Planned Capacity |
|---|---|---|---|
| Solar | 5.3 GW | 0.11 GW | 3.15 GW |
| Wind | 1.7 GW | 0.136 GW | 1.38 GW |
| Storage | 2 GW | 0.003 GW | 0.96 GW |
ISO Overview
| Type | 2024 Planned Capacity | 2024 New Capacity | 2025 Planned Capacity |
|---|---|---|---|
| Solar | 5.2 GW | 4.41 GW | 18.1 GW |
| Wind | 2.9 GW | 0.62 GW | 9.49 GW |
| Storage | 3 GW | 0.0 GW | 9.43 GW |
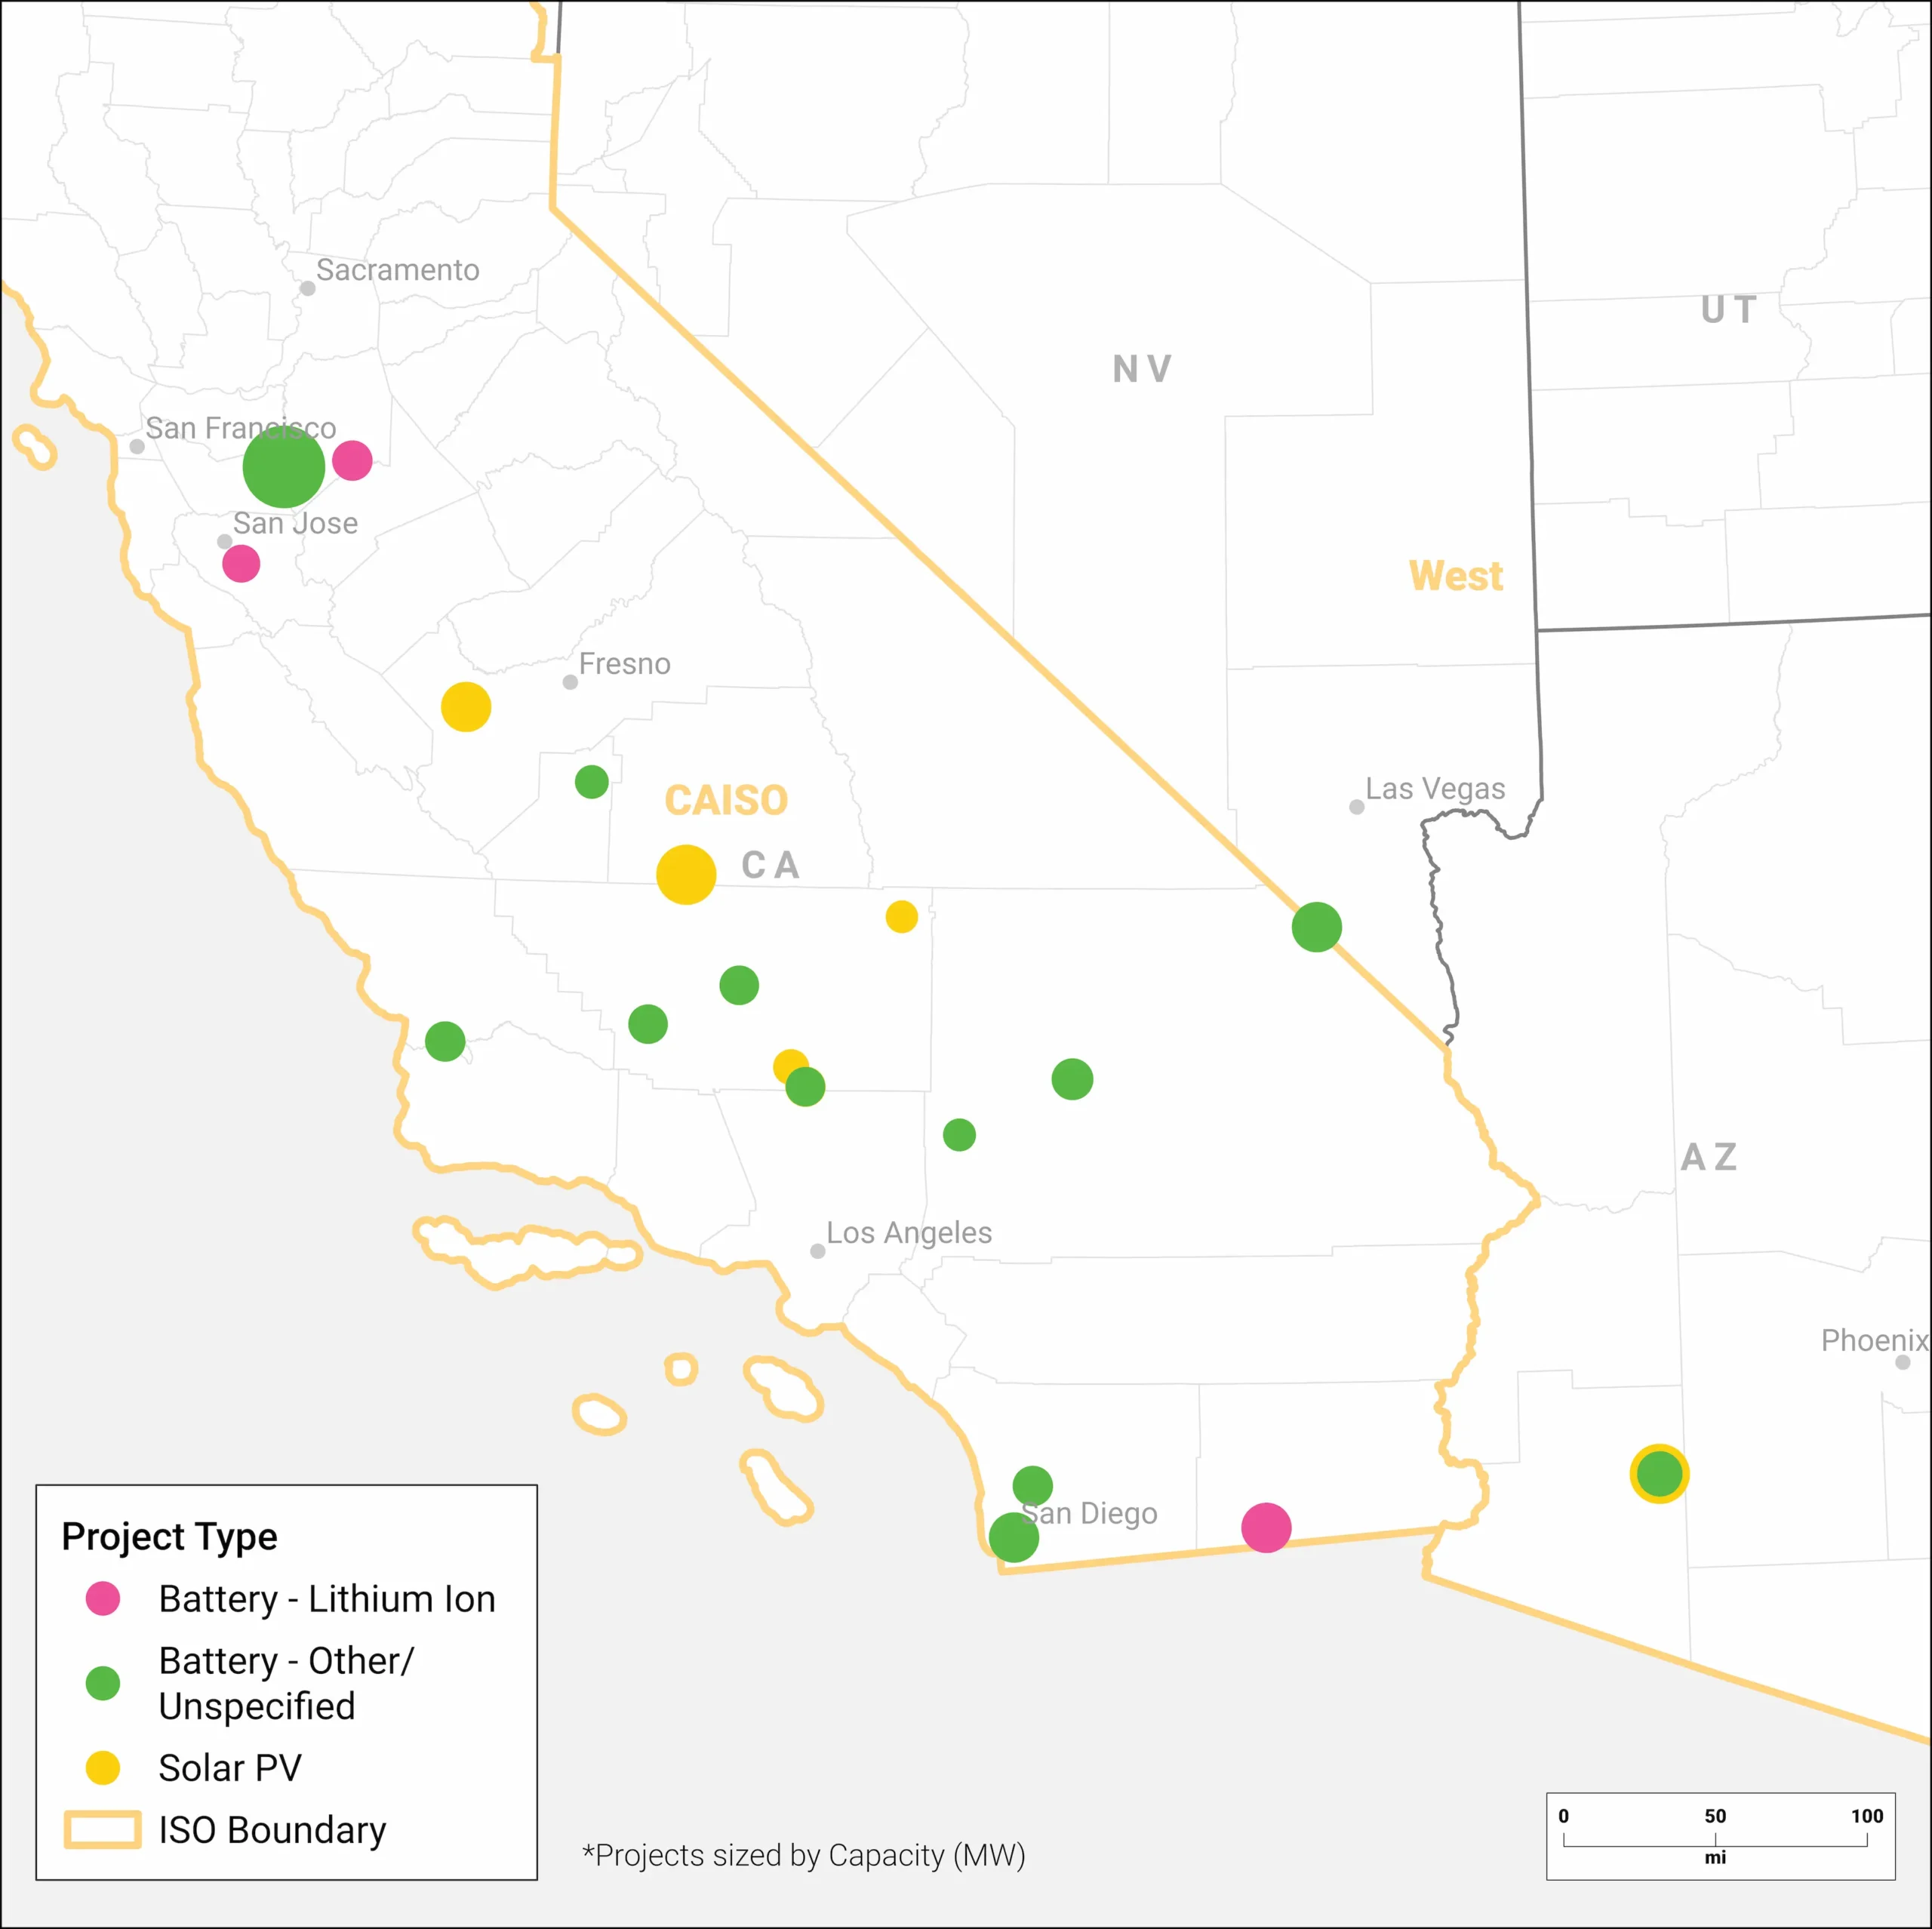
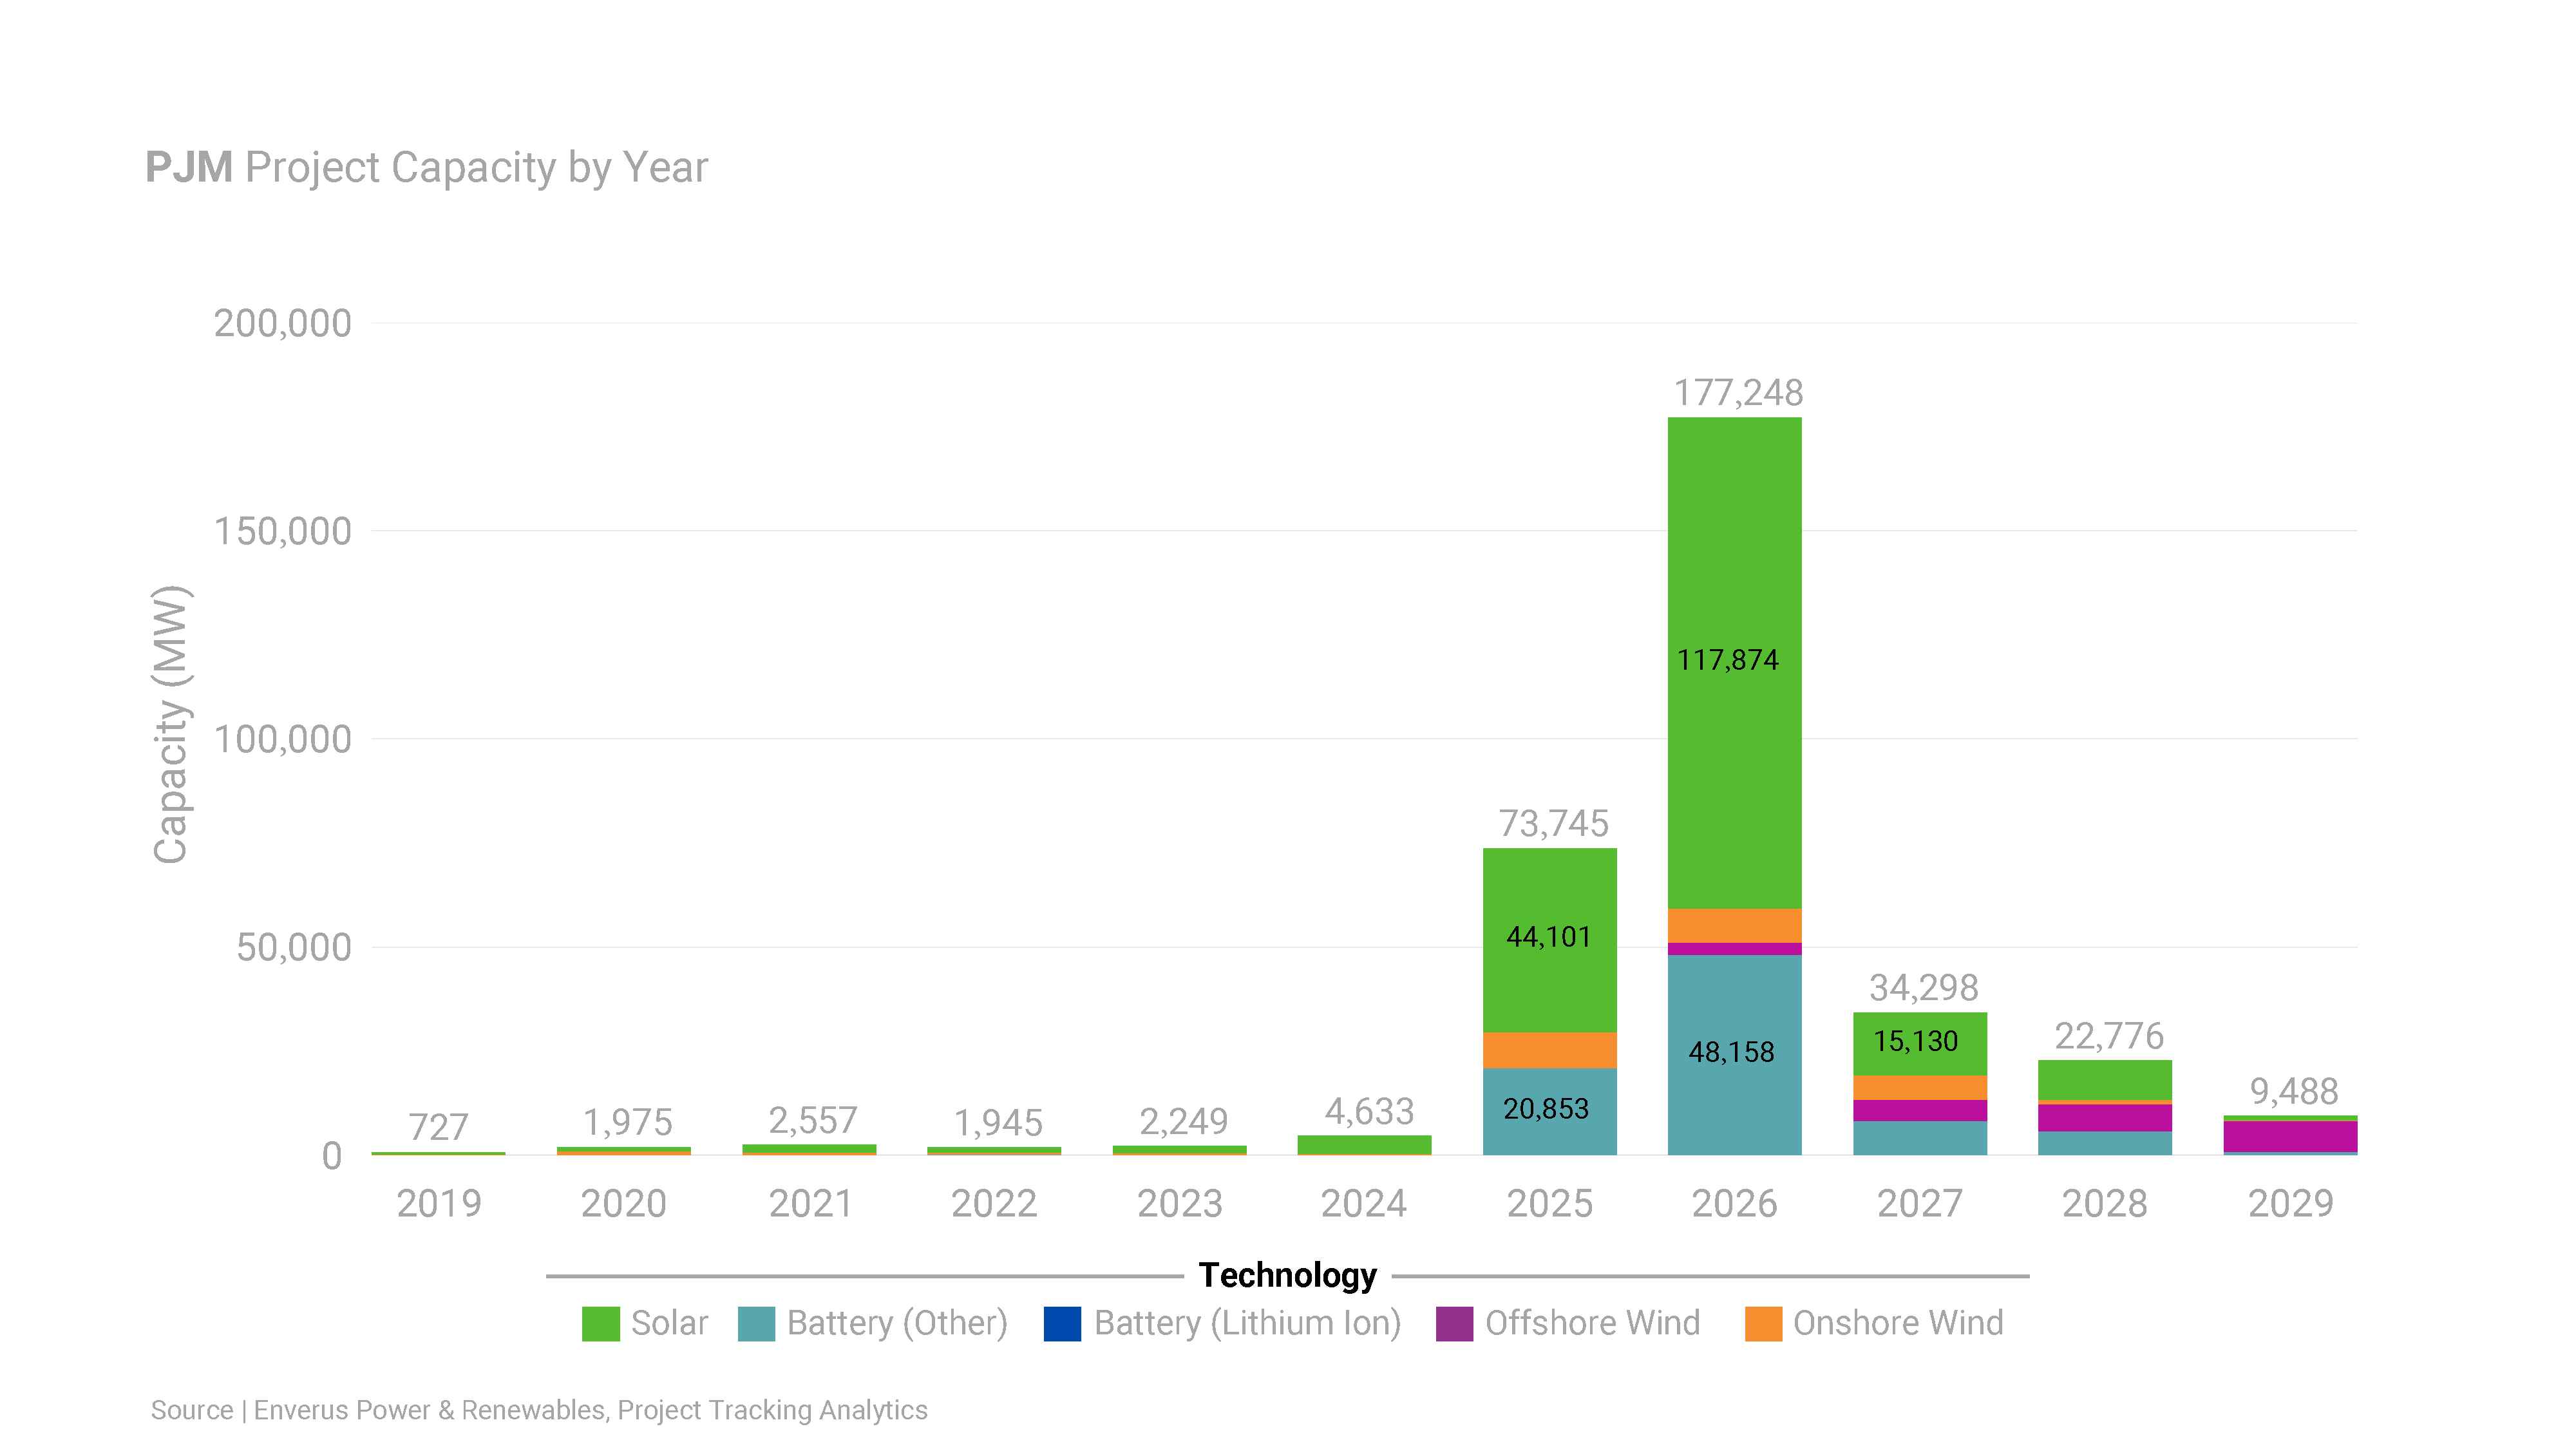
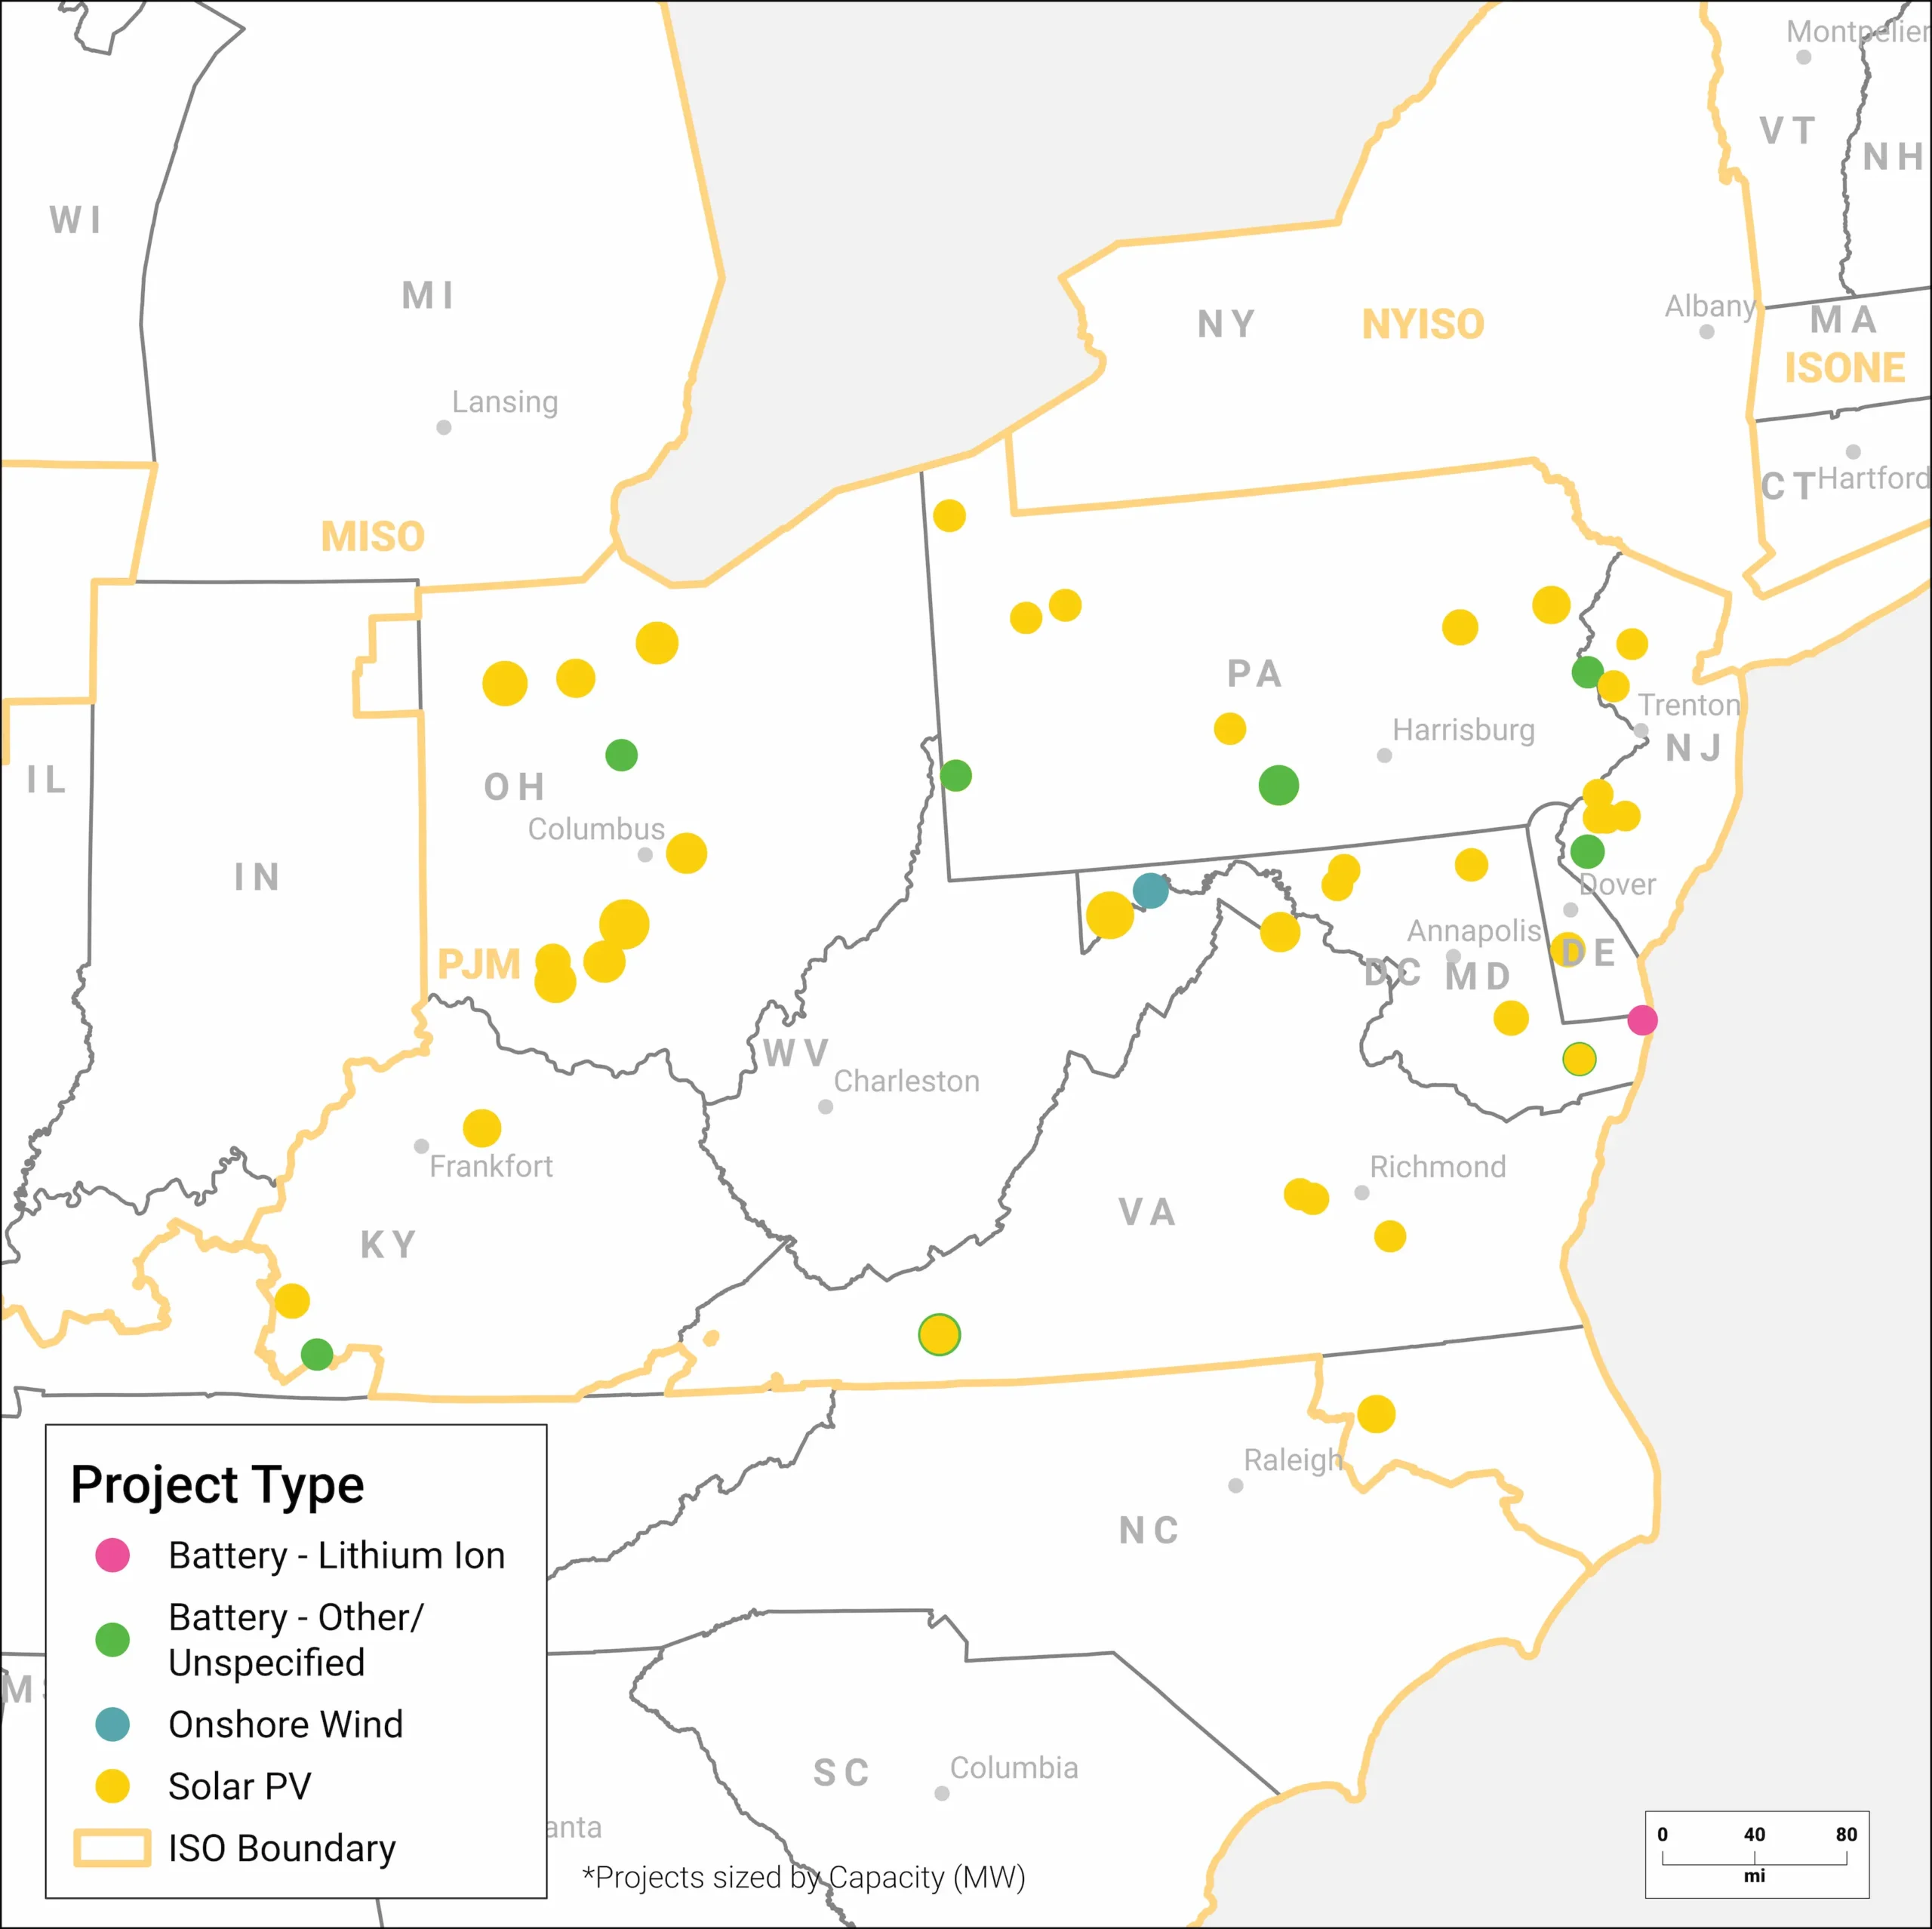
ISO Overview
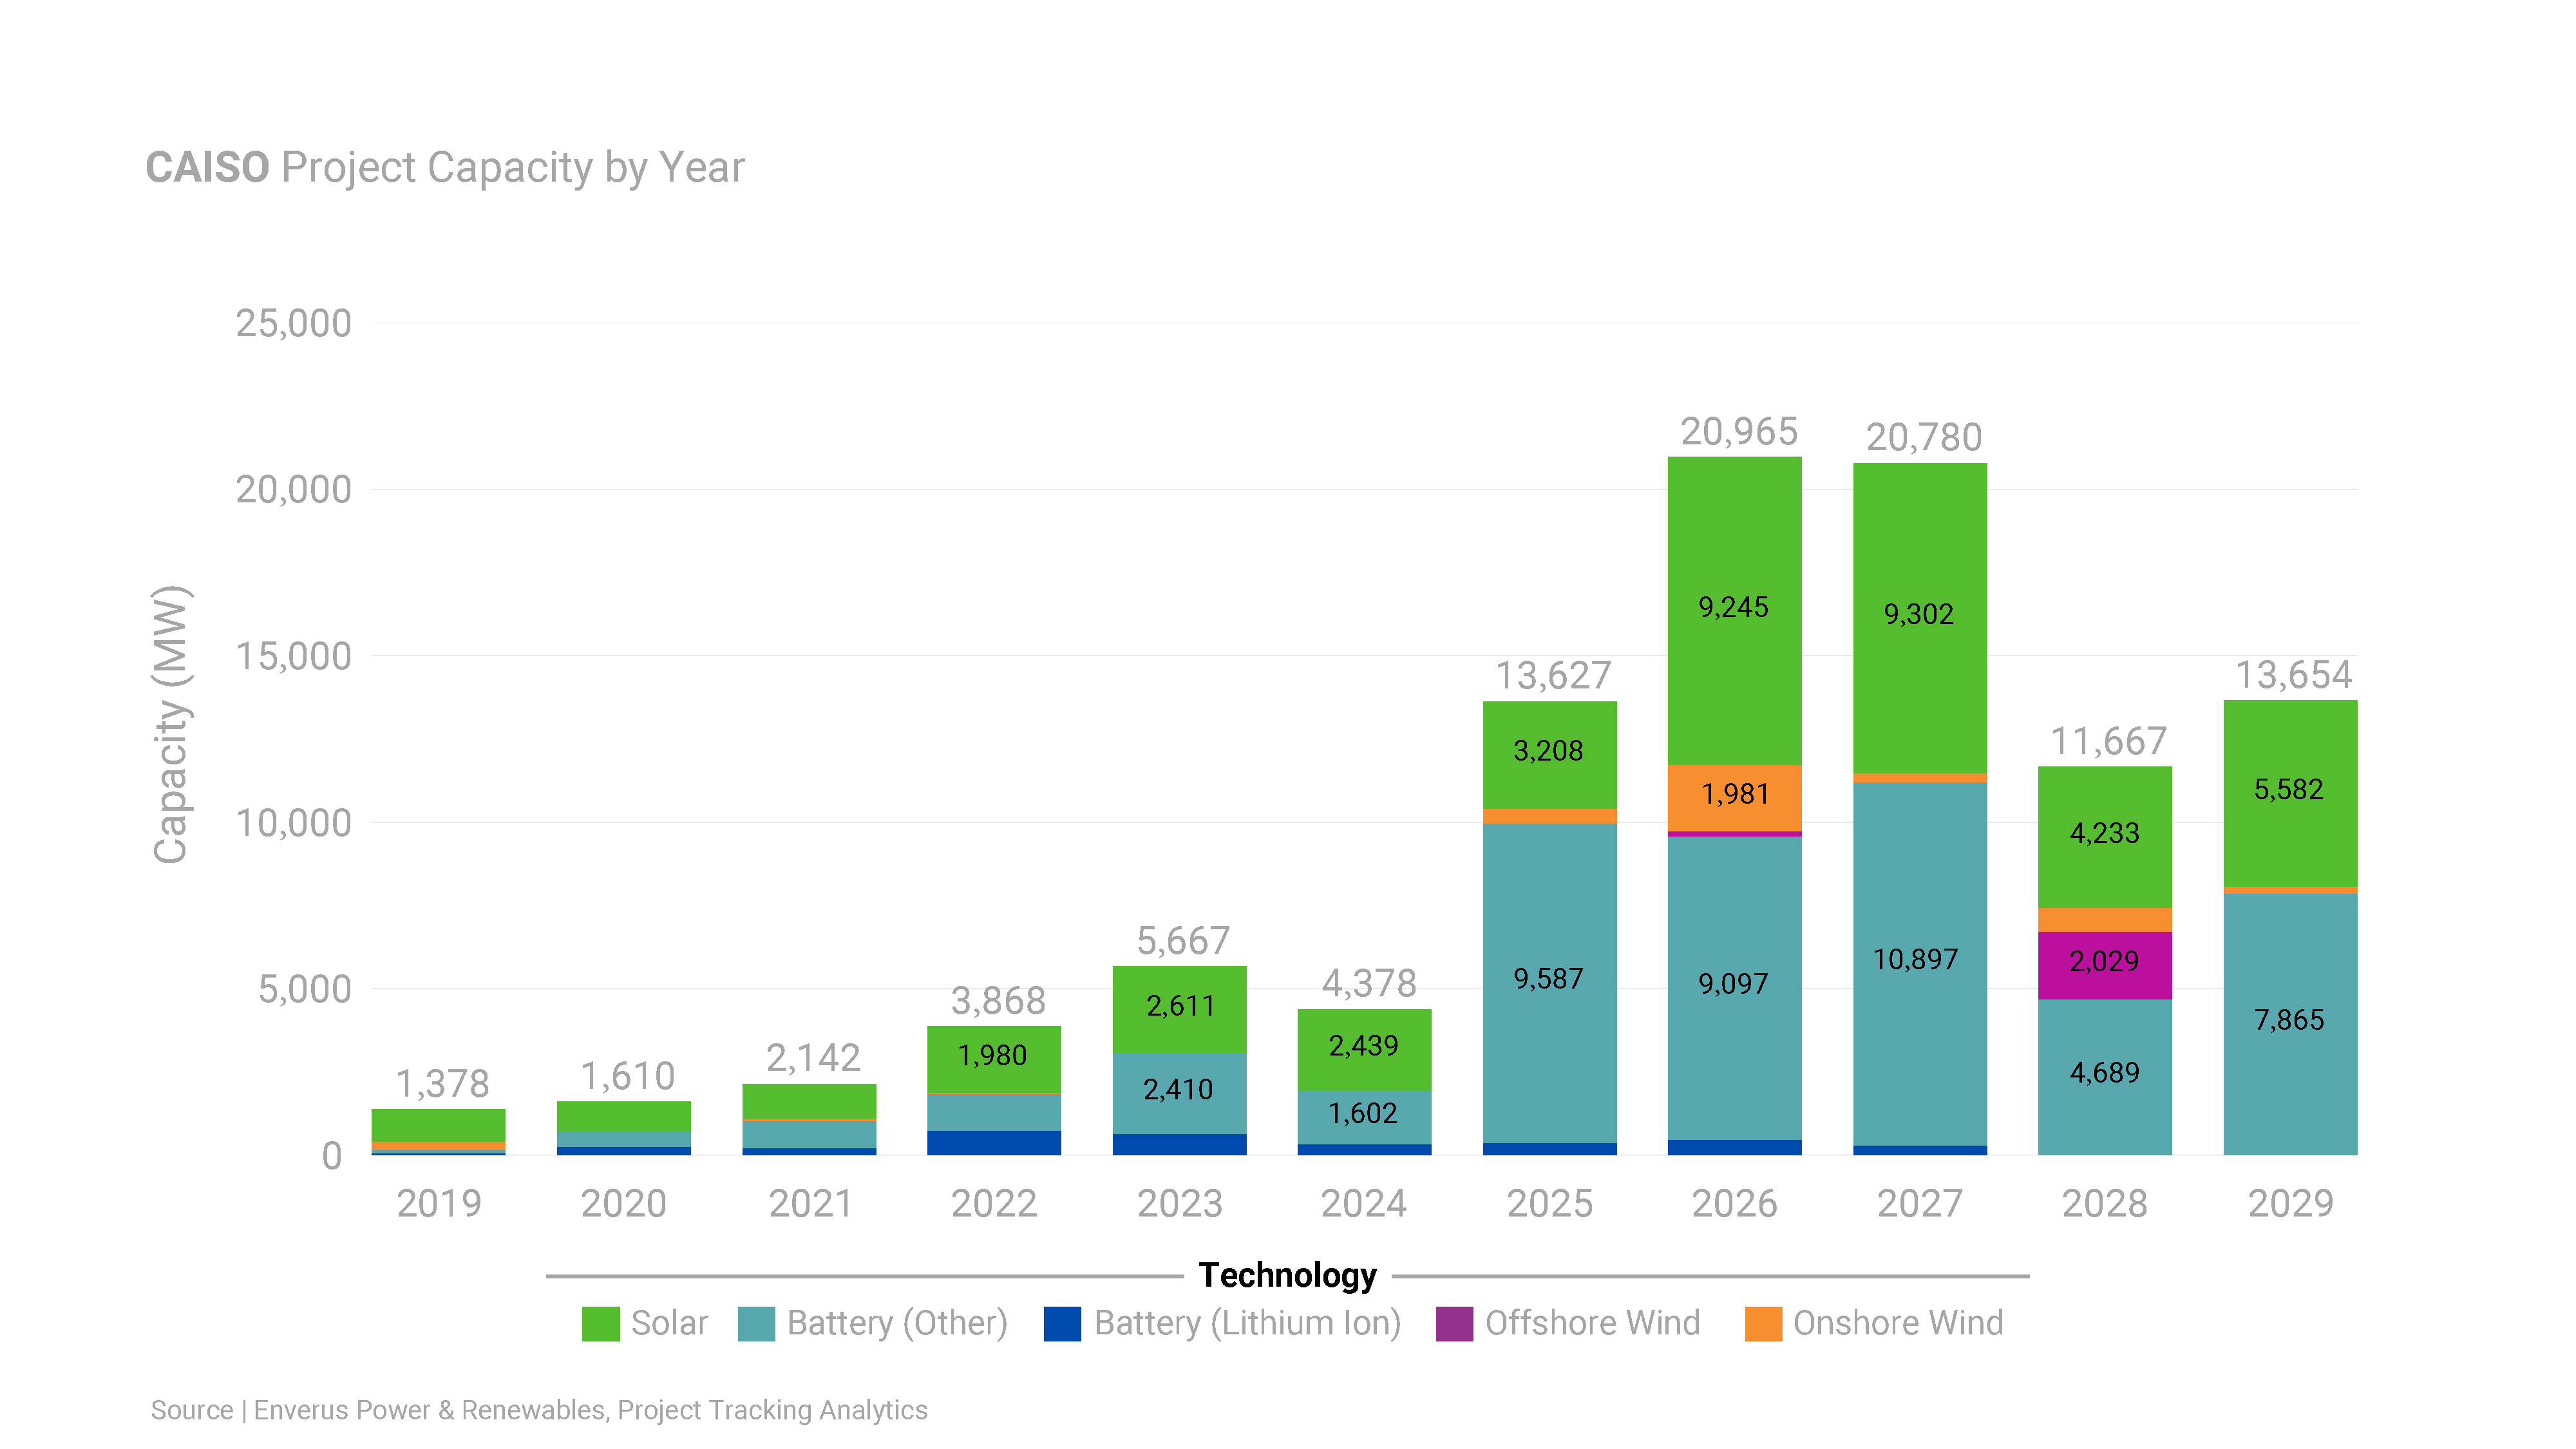
| Type | 2024 Planned Capacity | 2024 New Capacity | 2025 Planned Capacity |
|---|---|---|---|
| Solar | 46.1 GW | 4.27 GW | 44.1 GW |
| Wind | 5.1 GW | 0.262 GW | 8.74 GW |
| Storage | 40.6 GW | 0.09 GW | 20.9 GW |
ISO Overview
| Type | 2024 Planned Capacity | 2024 New Capacity | 2025 Planned Capacity |
|---|---|---|---|
| Solar | 1.7 GW | 0.33 GW | 2.17 GW |
| Wind | 3.5 GW | 0.40 GW | 4.73 GW |
| Storage | 1.4 GW | 0.0 GW | 1.76 GW |
ISO Overview
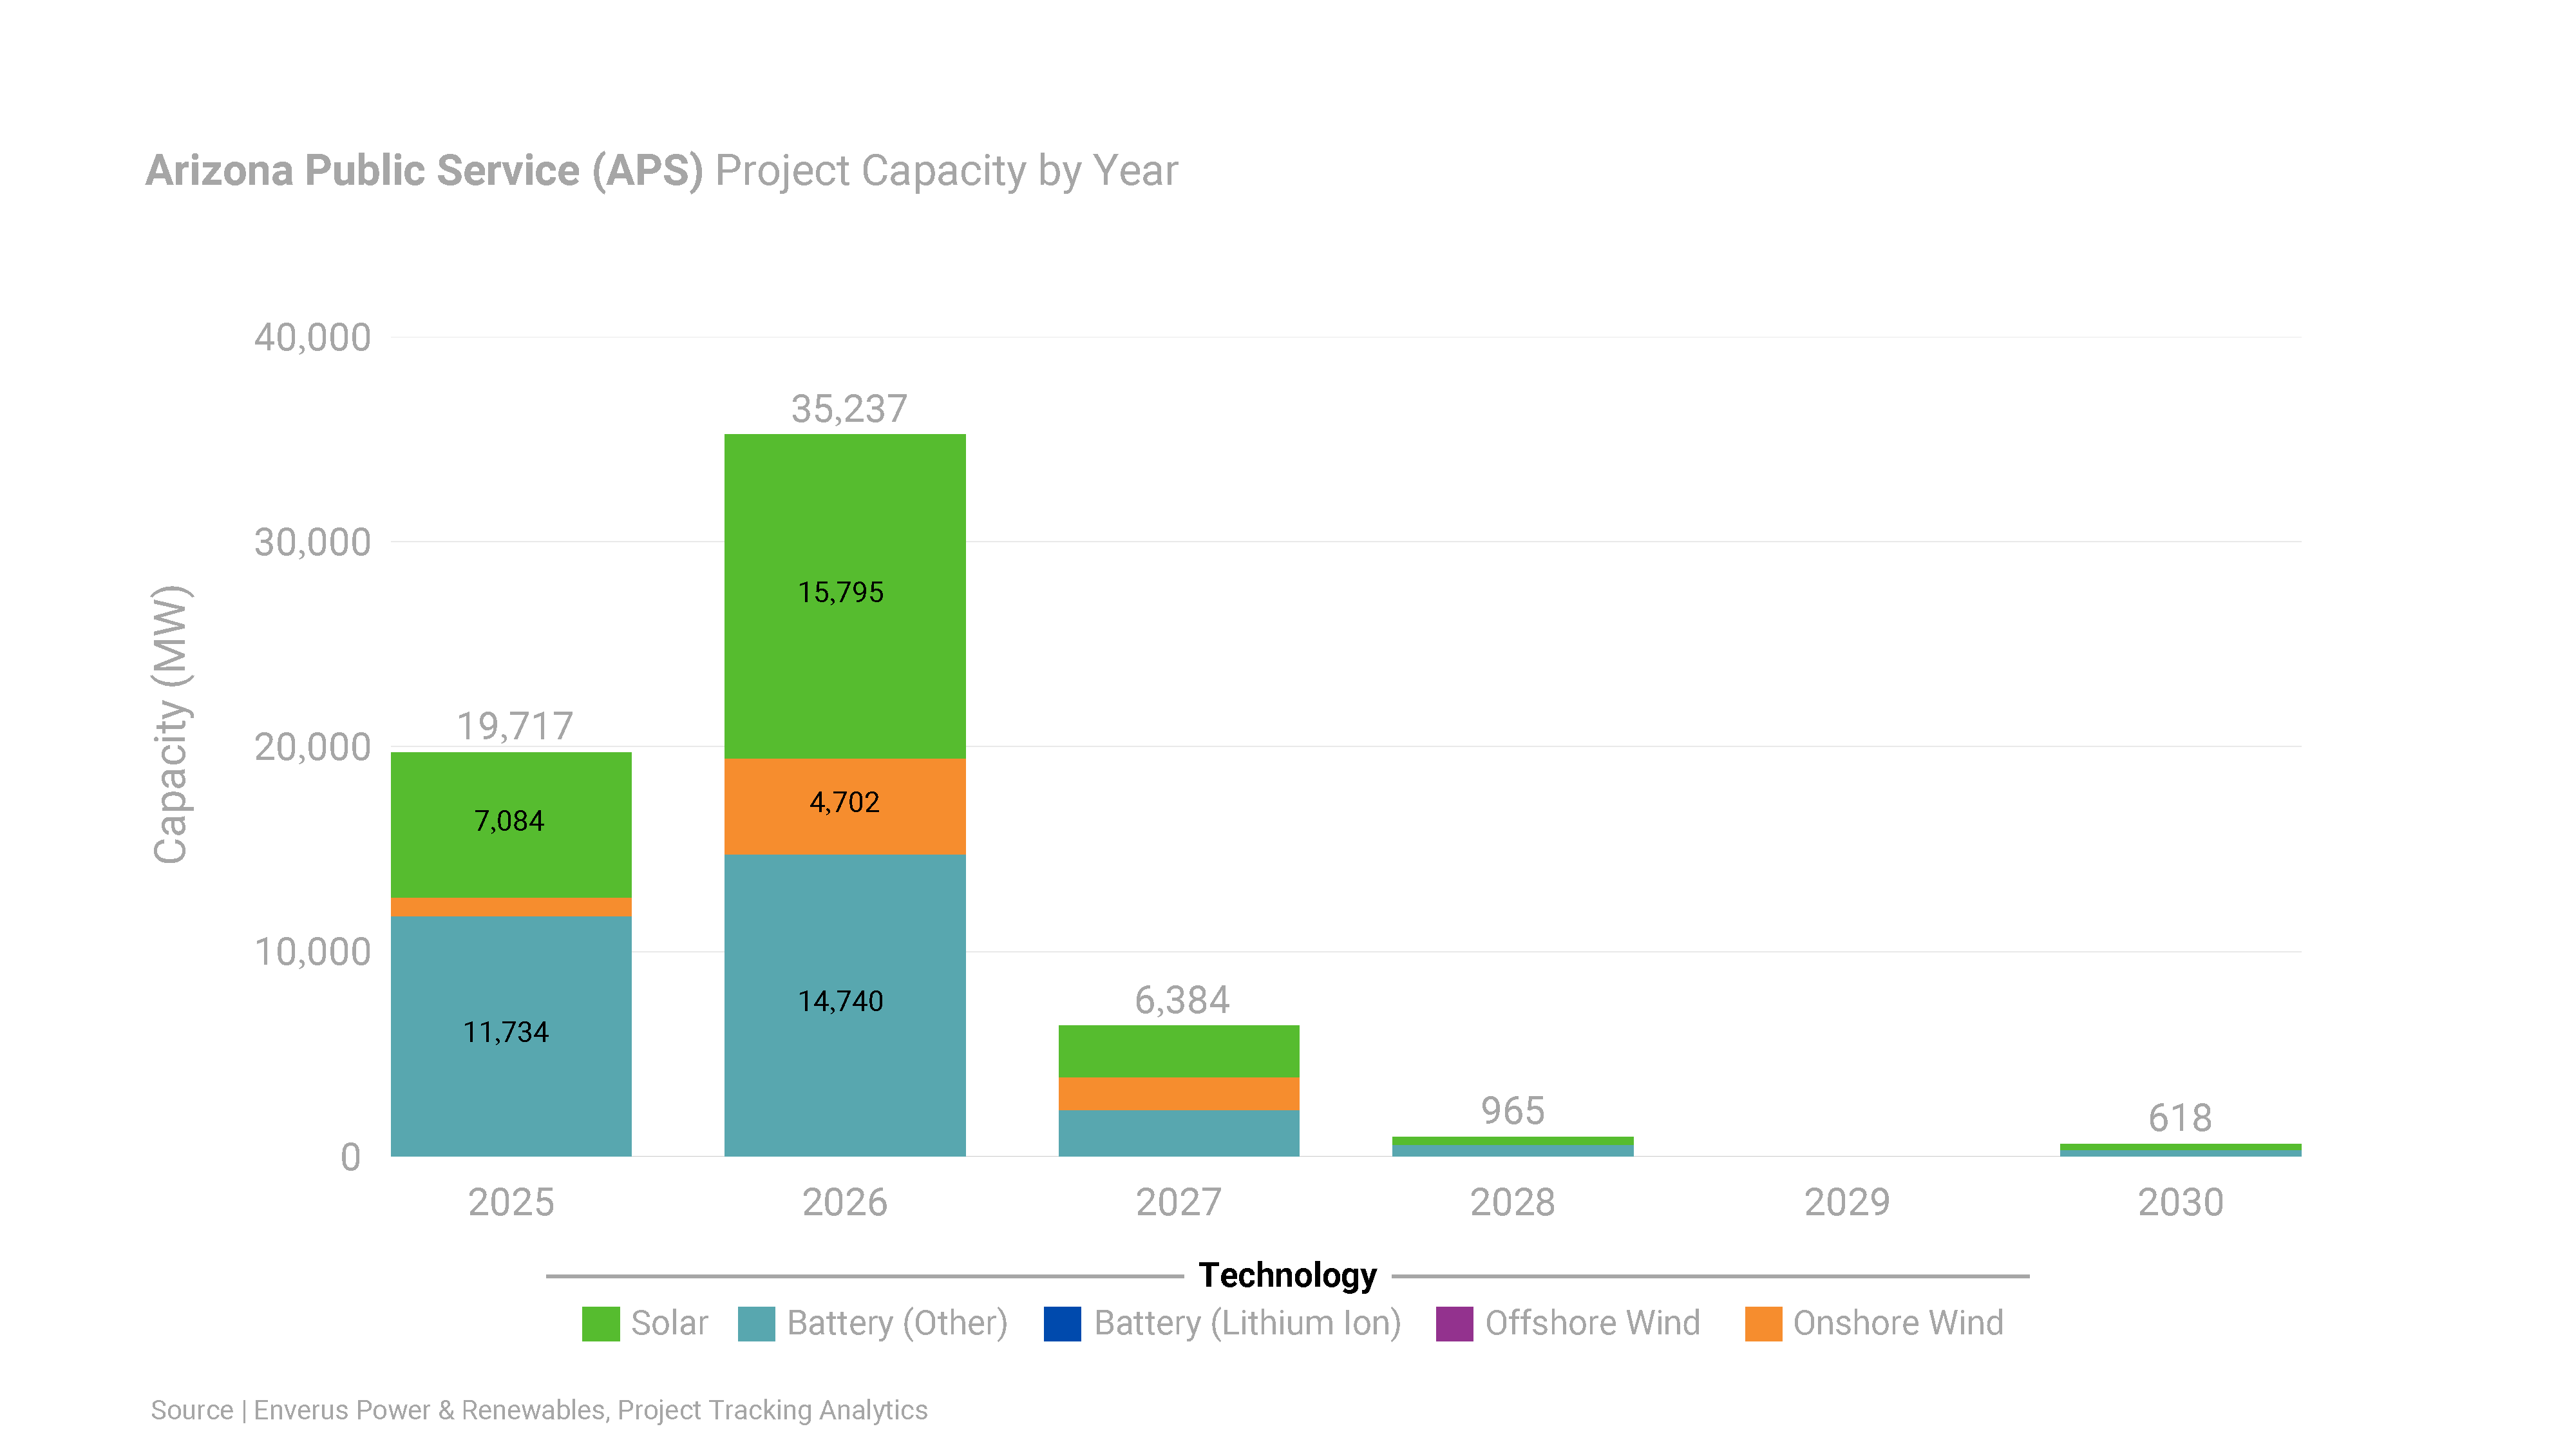
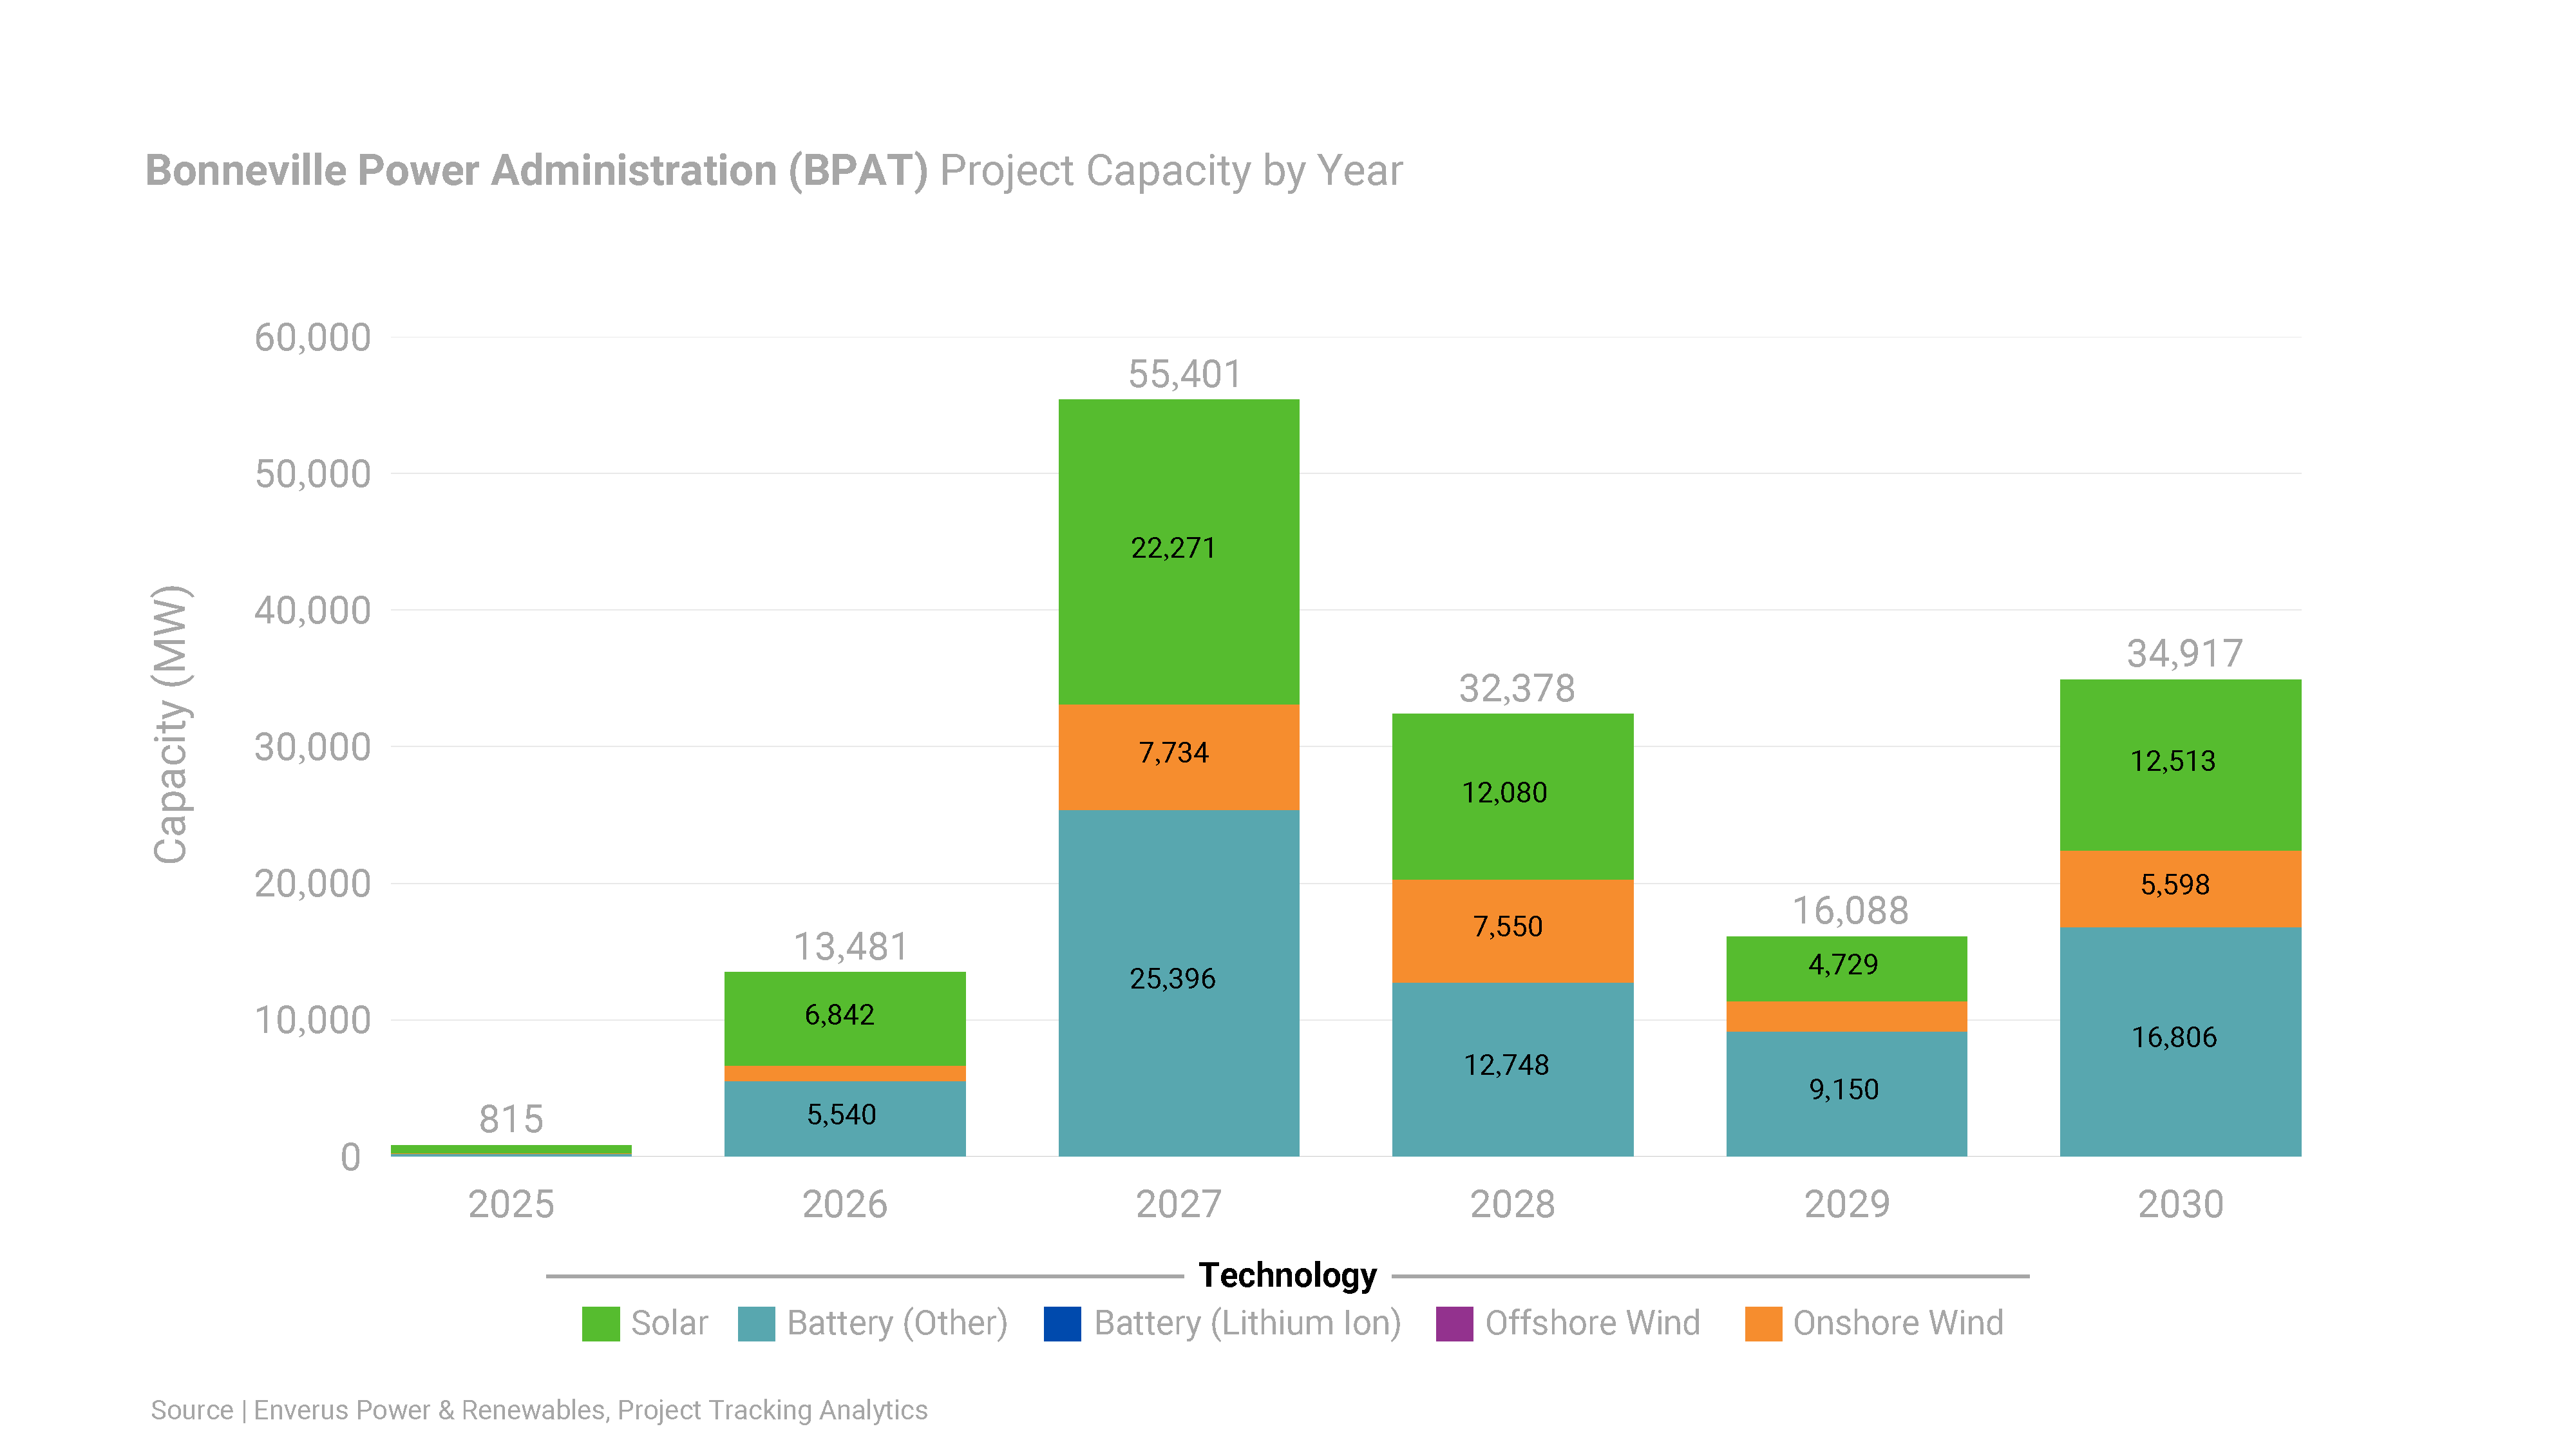
| Type | 2025 Planned Capacity |
|---|---|
| Solar | 7.08 GW |
| Wind | 0.90 GW |
| Storage | 11.73 GW |
Displaying only 2025 planned capacity due to the recent integration of utility queues in PRISM, ensuring maximum accuracy.
| Type | 2025 Planned Capacity |
|---|---|
| Solar | 0.584 GW |
| Wind | 0.05 GW |
| Storage | 0.18 GW |
Displaying only 2025 planned capacity due to the recent integration of utility queues in PRISM, ensuring maximum accuracy.
Note on “Upcoming Projects With 2025 Operating Dates” graphs: Unlike the graphs showing projects under construction set to complete in 2025 in other regions, there are no qualifying solar, storage, or wind projects in NYISO or BPAT for 2025.
ISO Overview
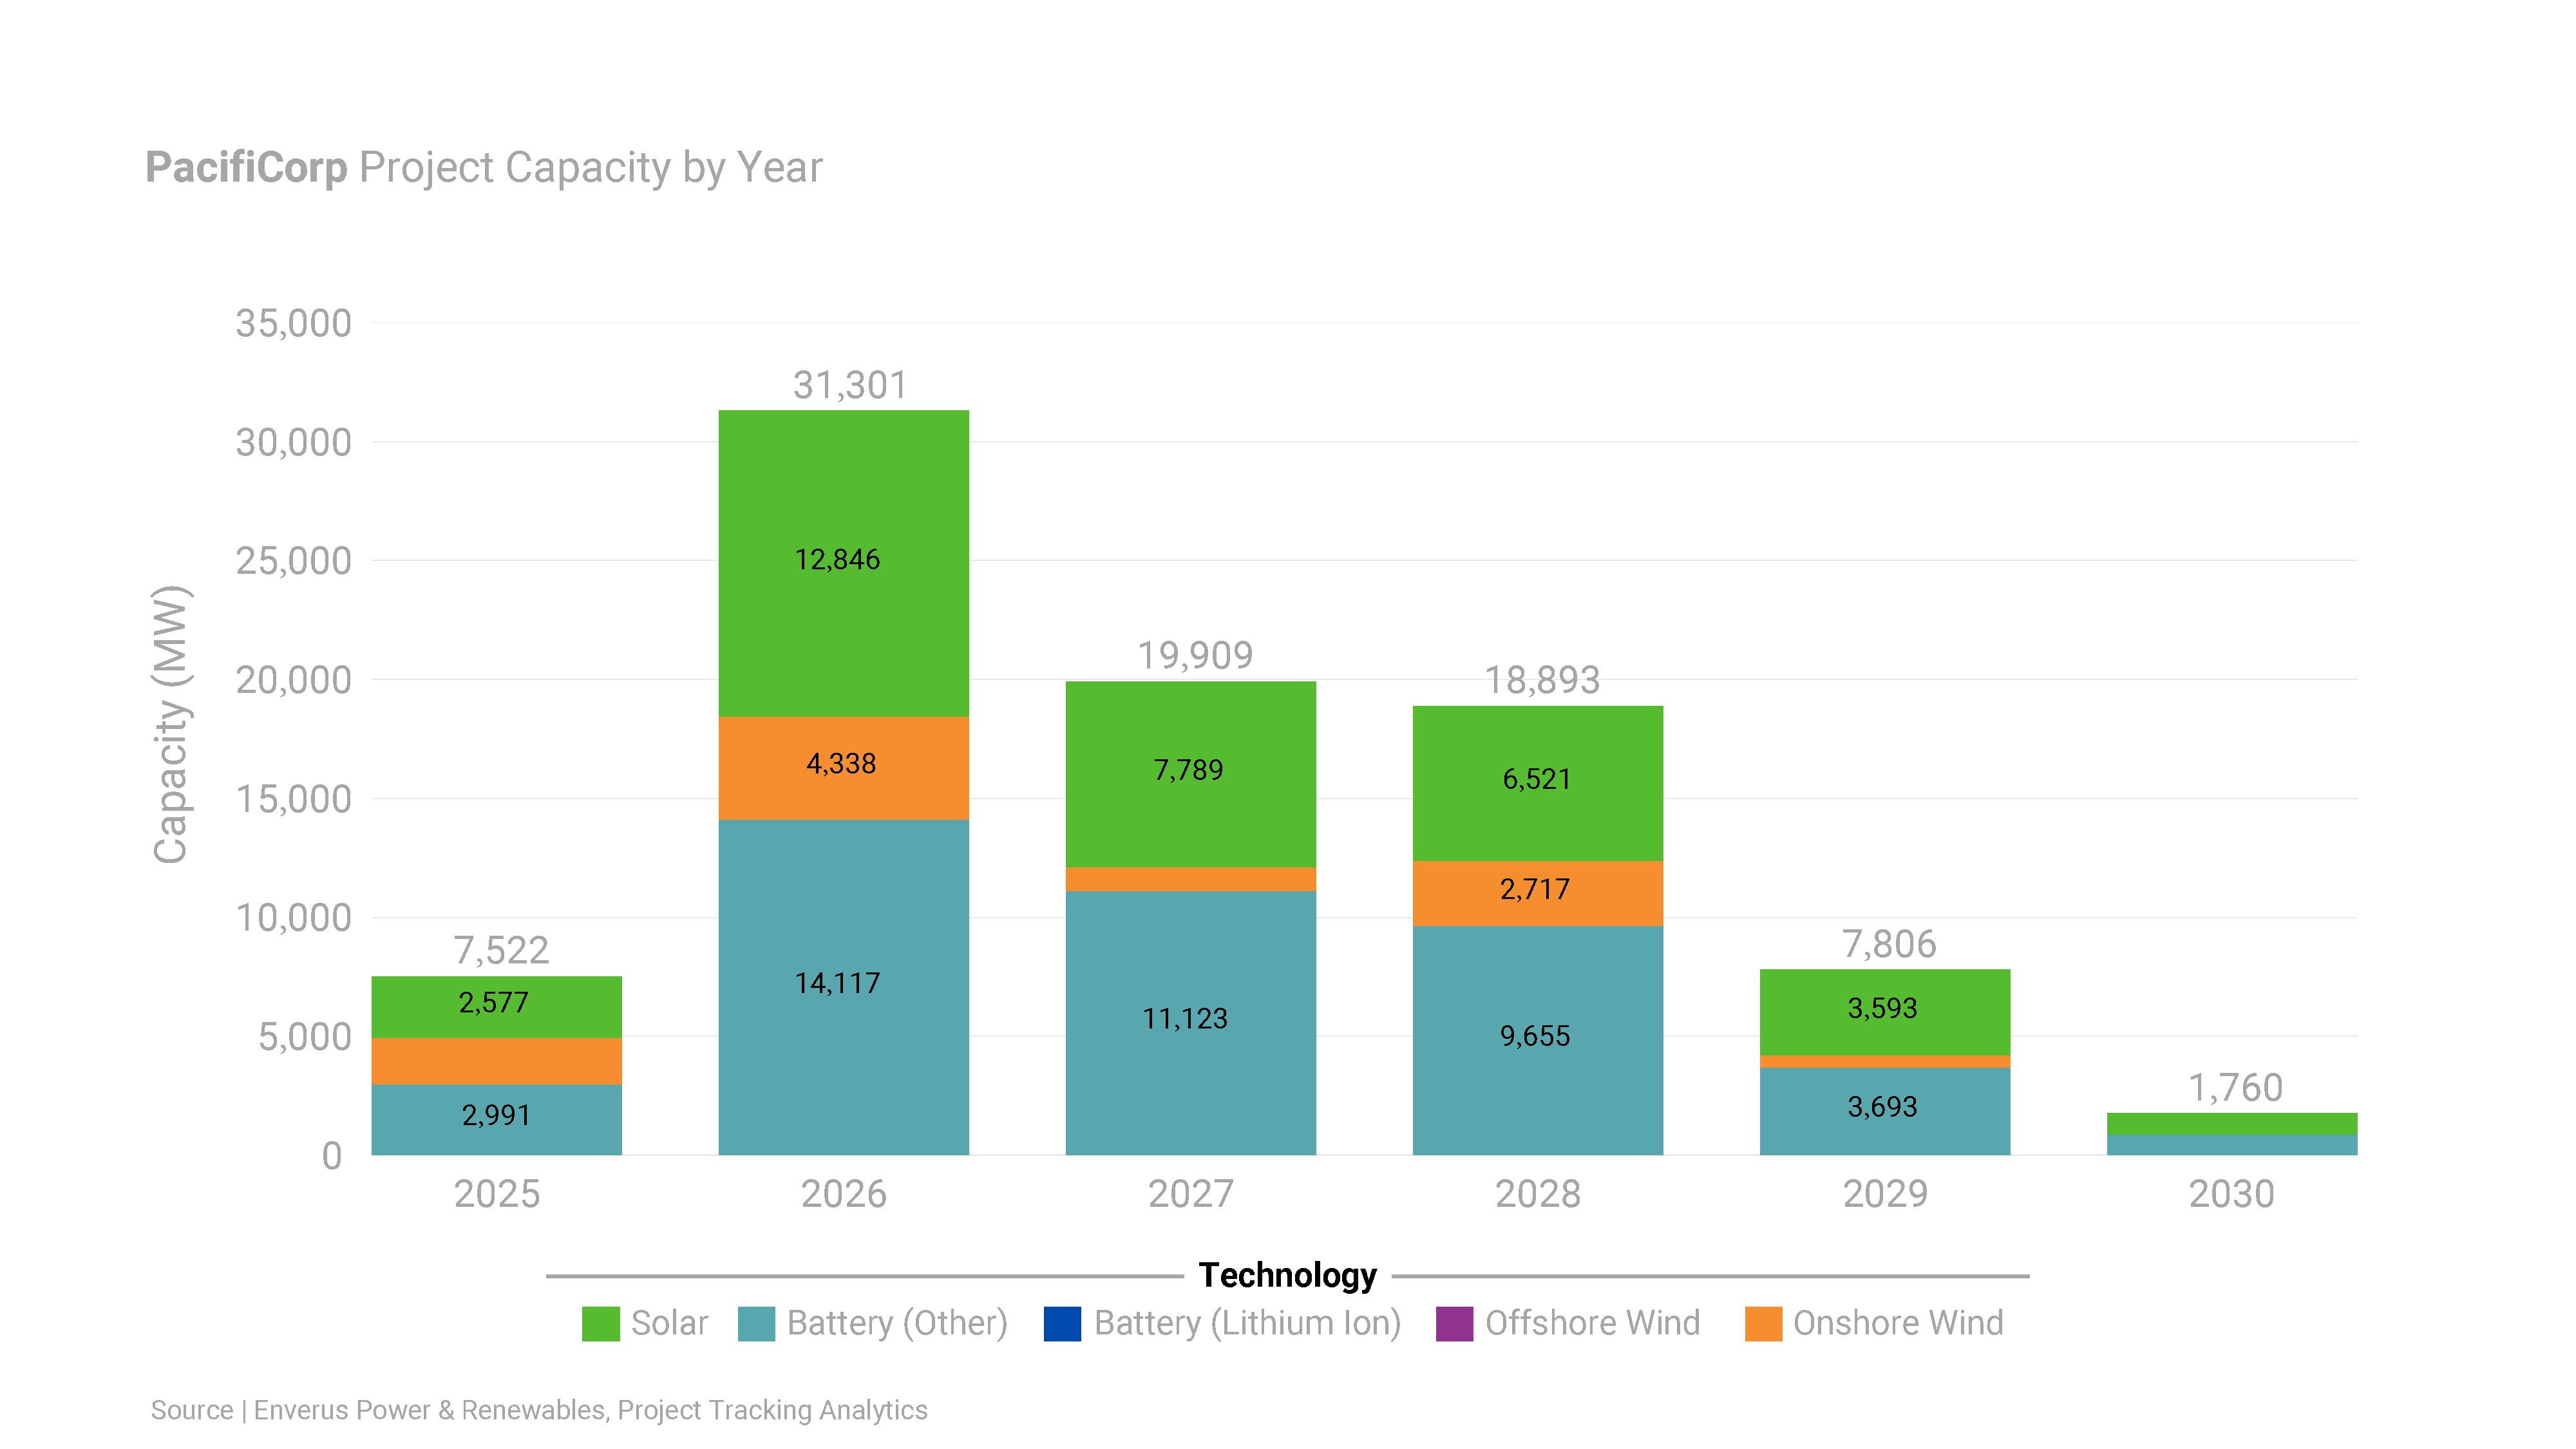
| Type | 2025 Planned Capacity |
|---|---|
| Solar | 2.57 GW |
| Wind | 1.95 GW |
| Storage | 2.99 GW |
Displaying only 2025 planned capacity due to the recent integration of utility queues in PRISM, ensuring maximum accuracy.
ISO Overview
| Type | 2025 Planned Capacity |
|---|---|
| Solar | 2.17 GW |
| Wind | 0.0 GW |
| Storage | 1.18 GW |
Displaying only 2025 planned capacity due to the recent integration of utility queues in PRISM, ensuring maximum accuracy.
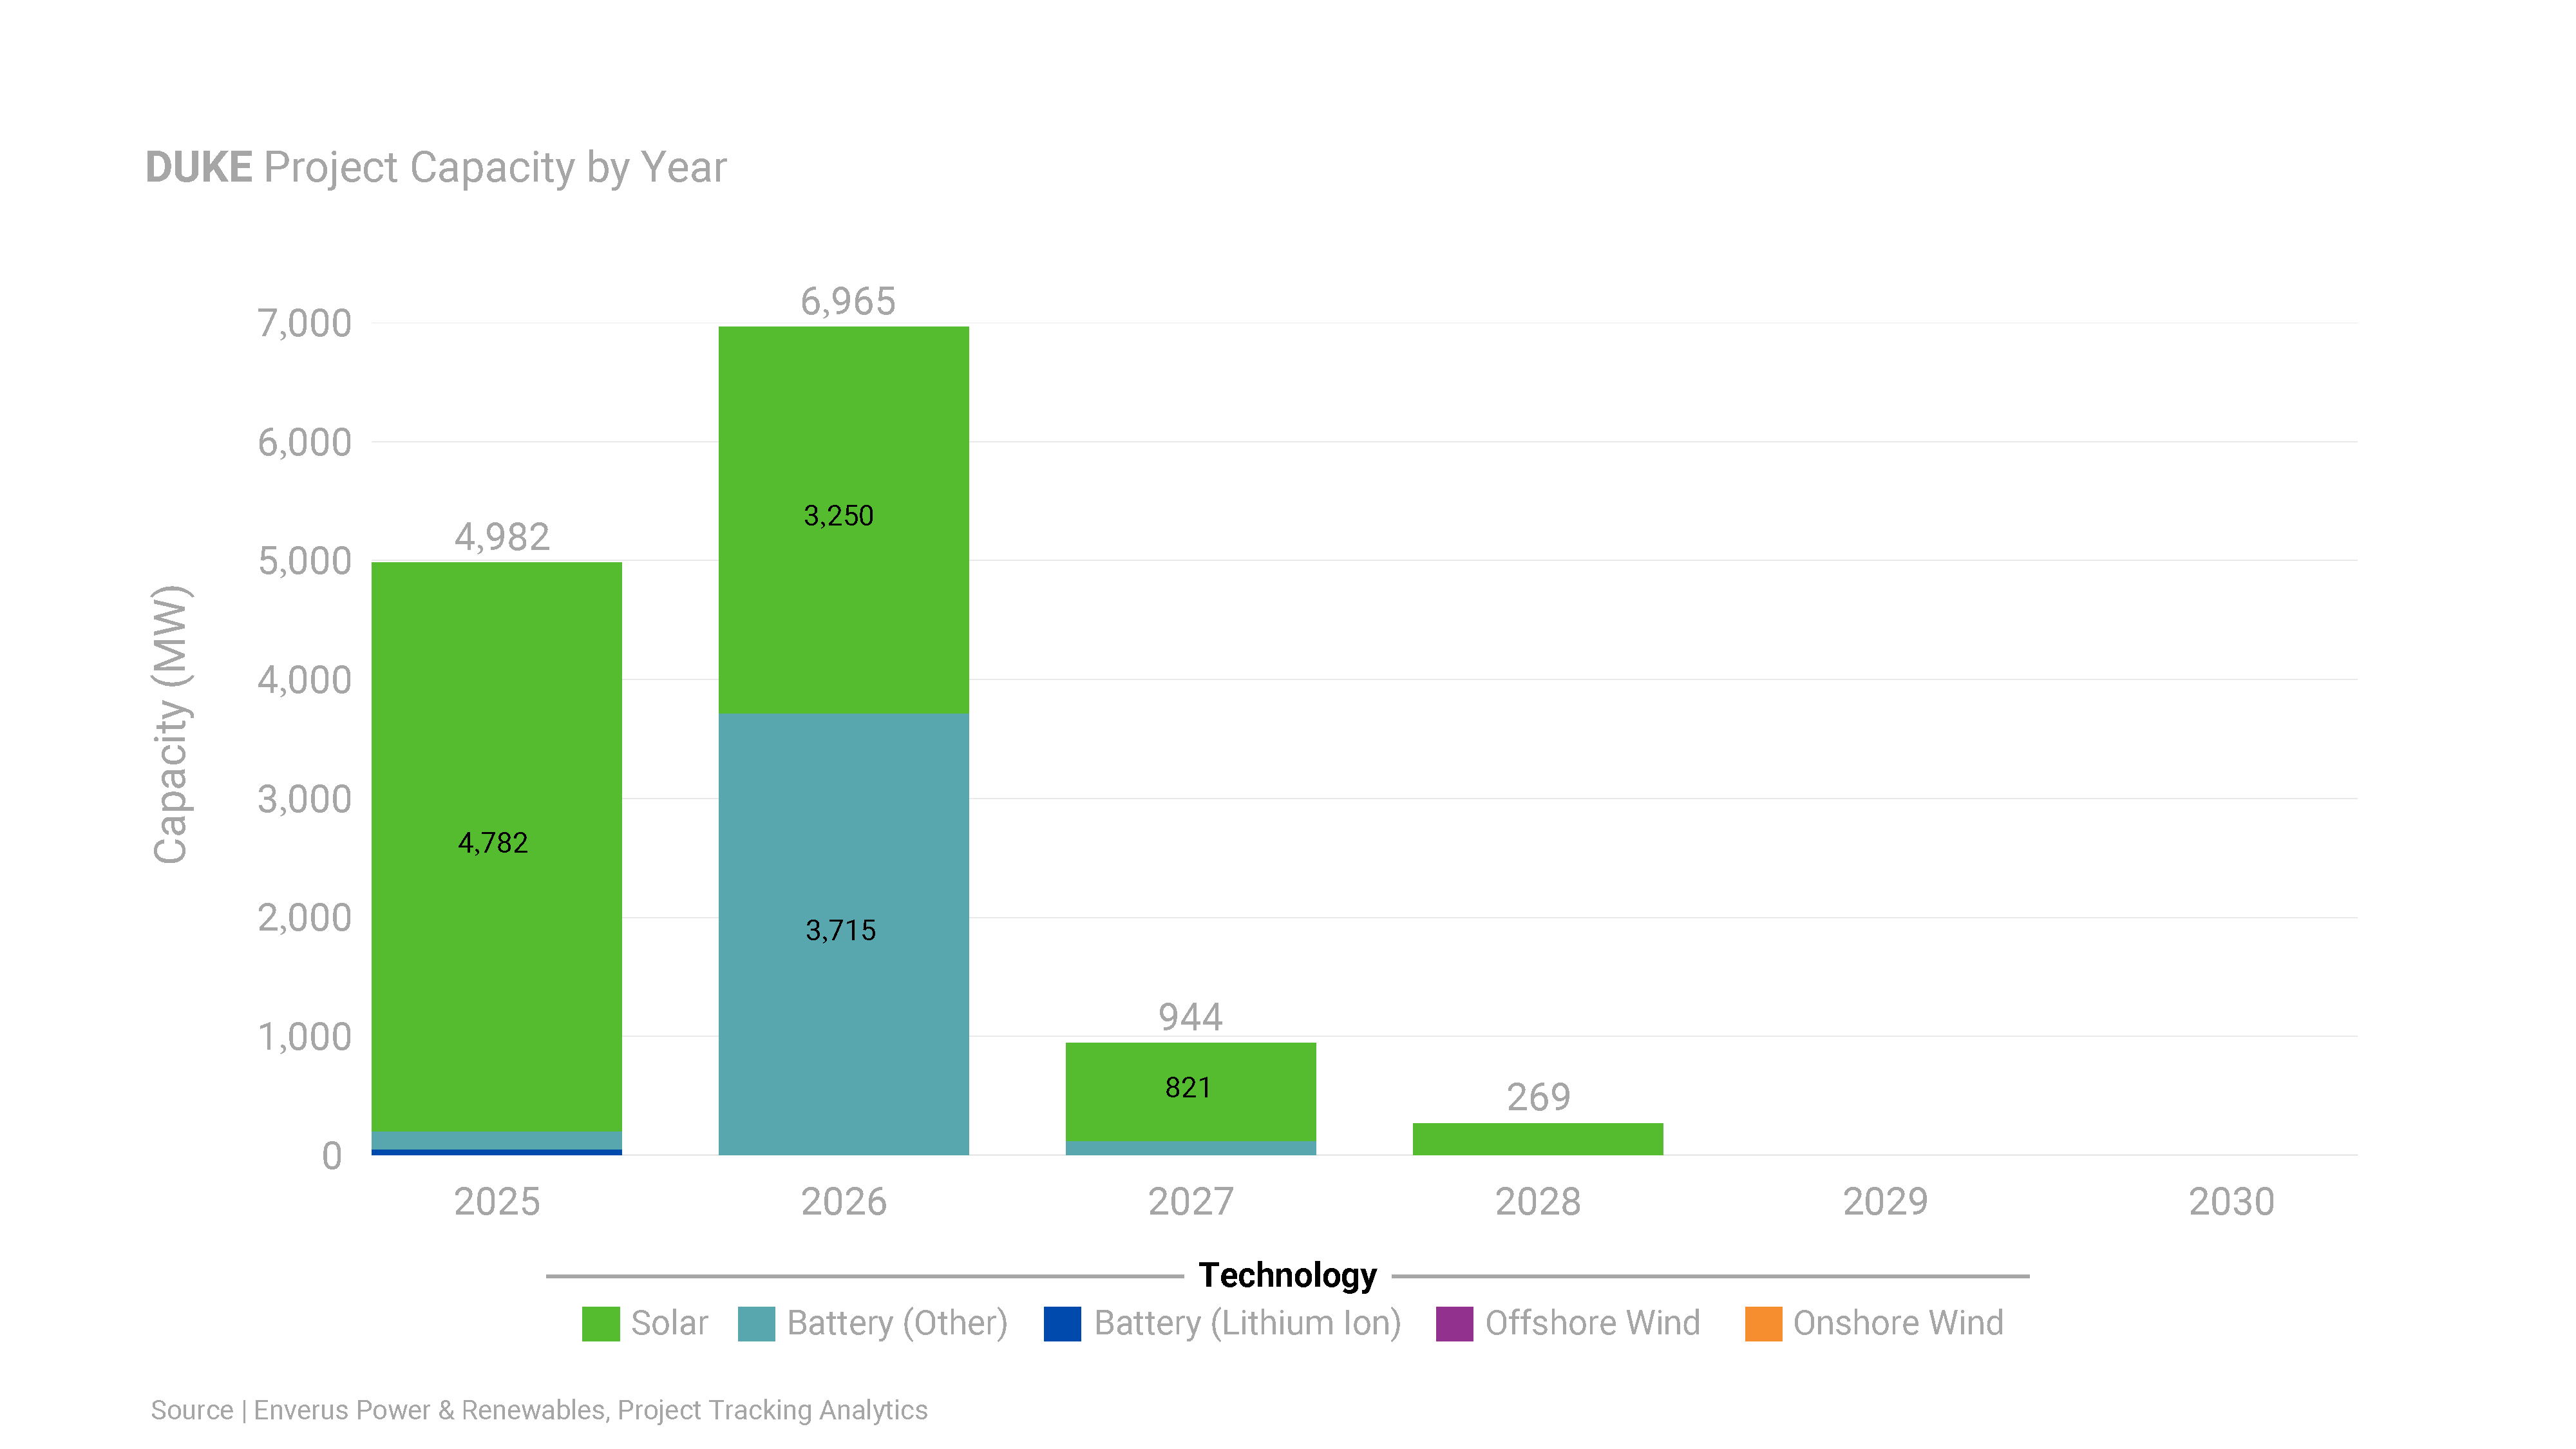
| Type | 2025 Planned Capacity |
|---|---|
| Solar | 4.78 GW |
| Wind | 0.0 GW |
| Storage | 0.2 GW |
Displaying only 2025 planned capacity due to the recent integration of utility queues in PRISM, ensuring maximum accuracy.
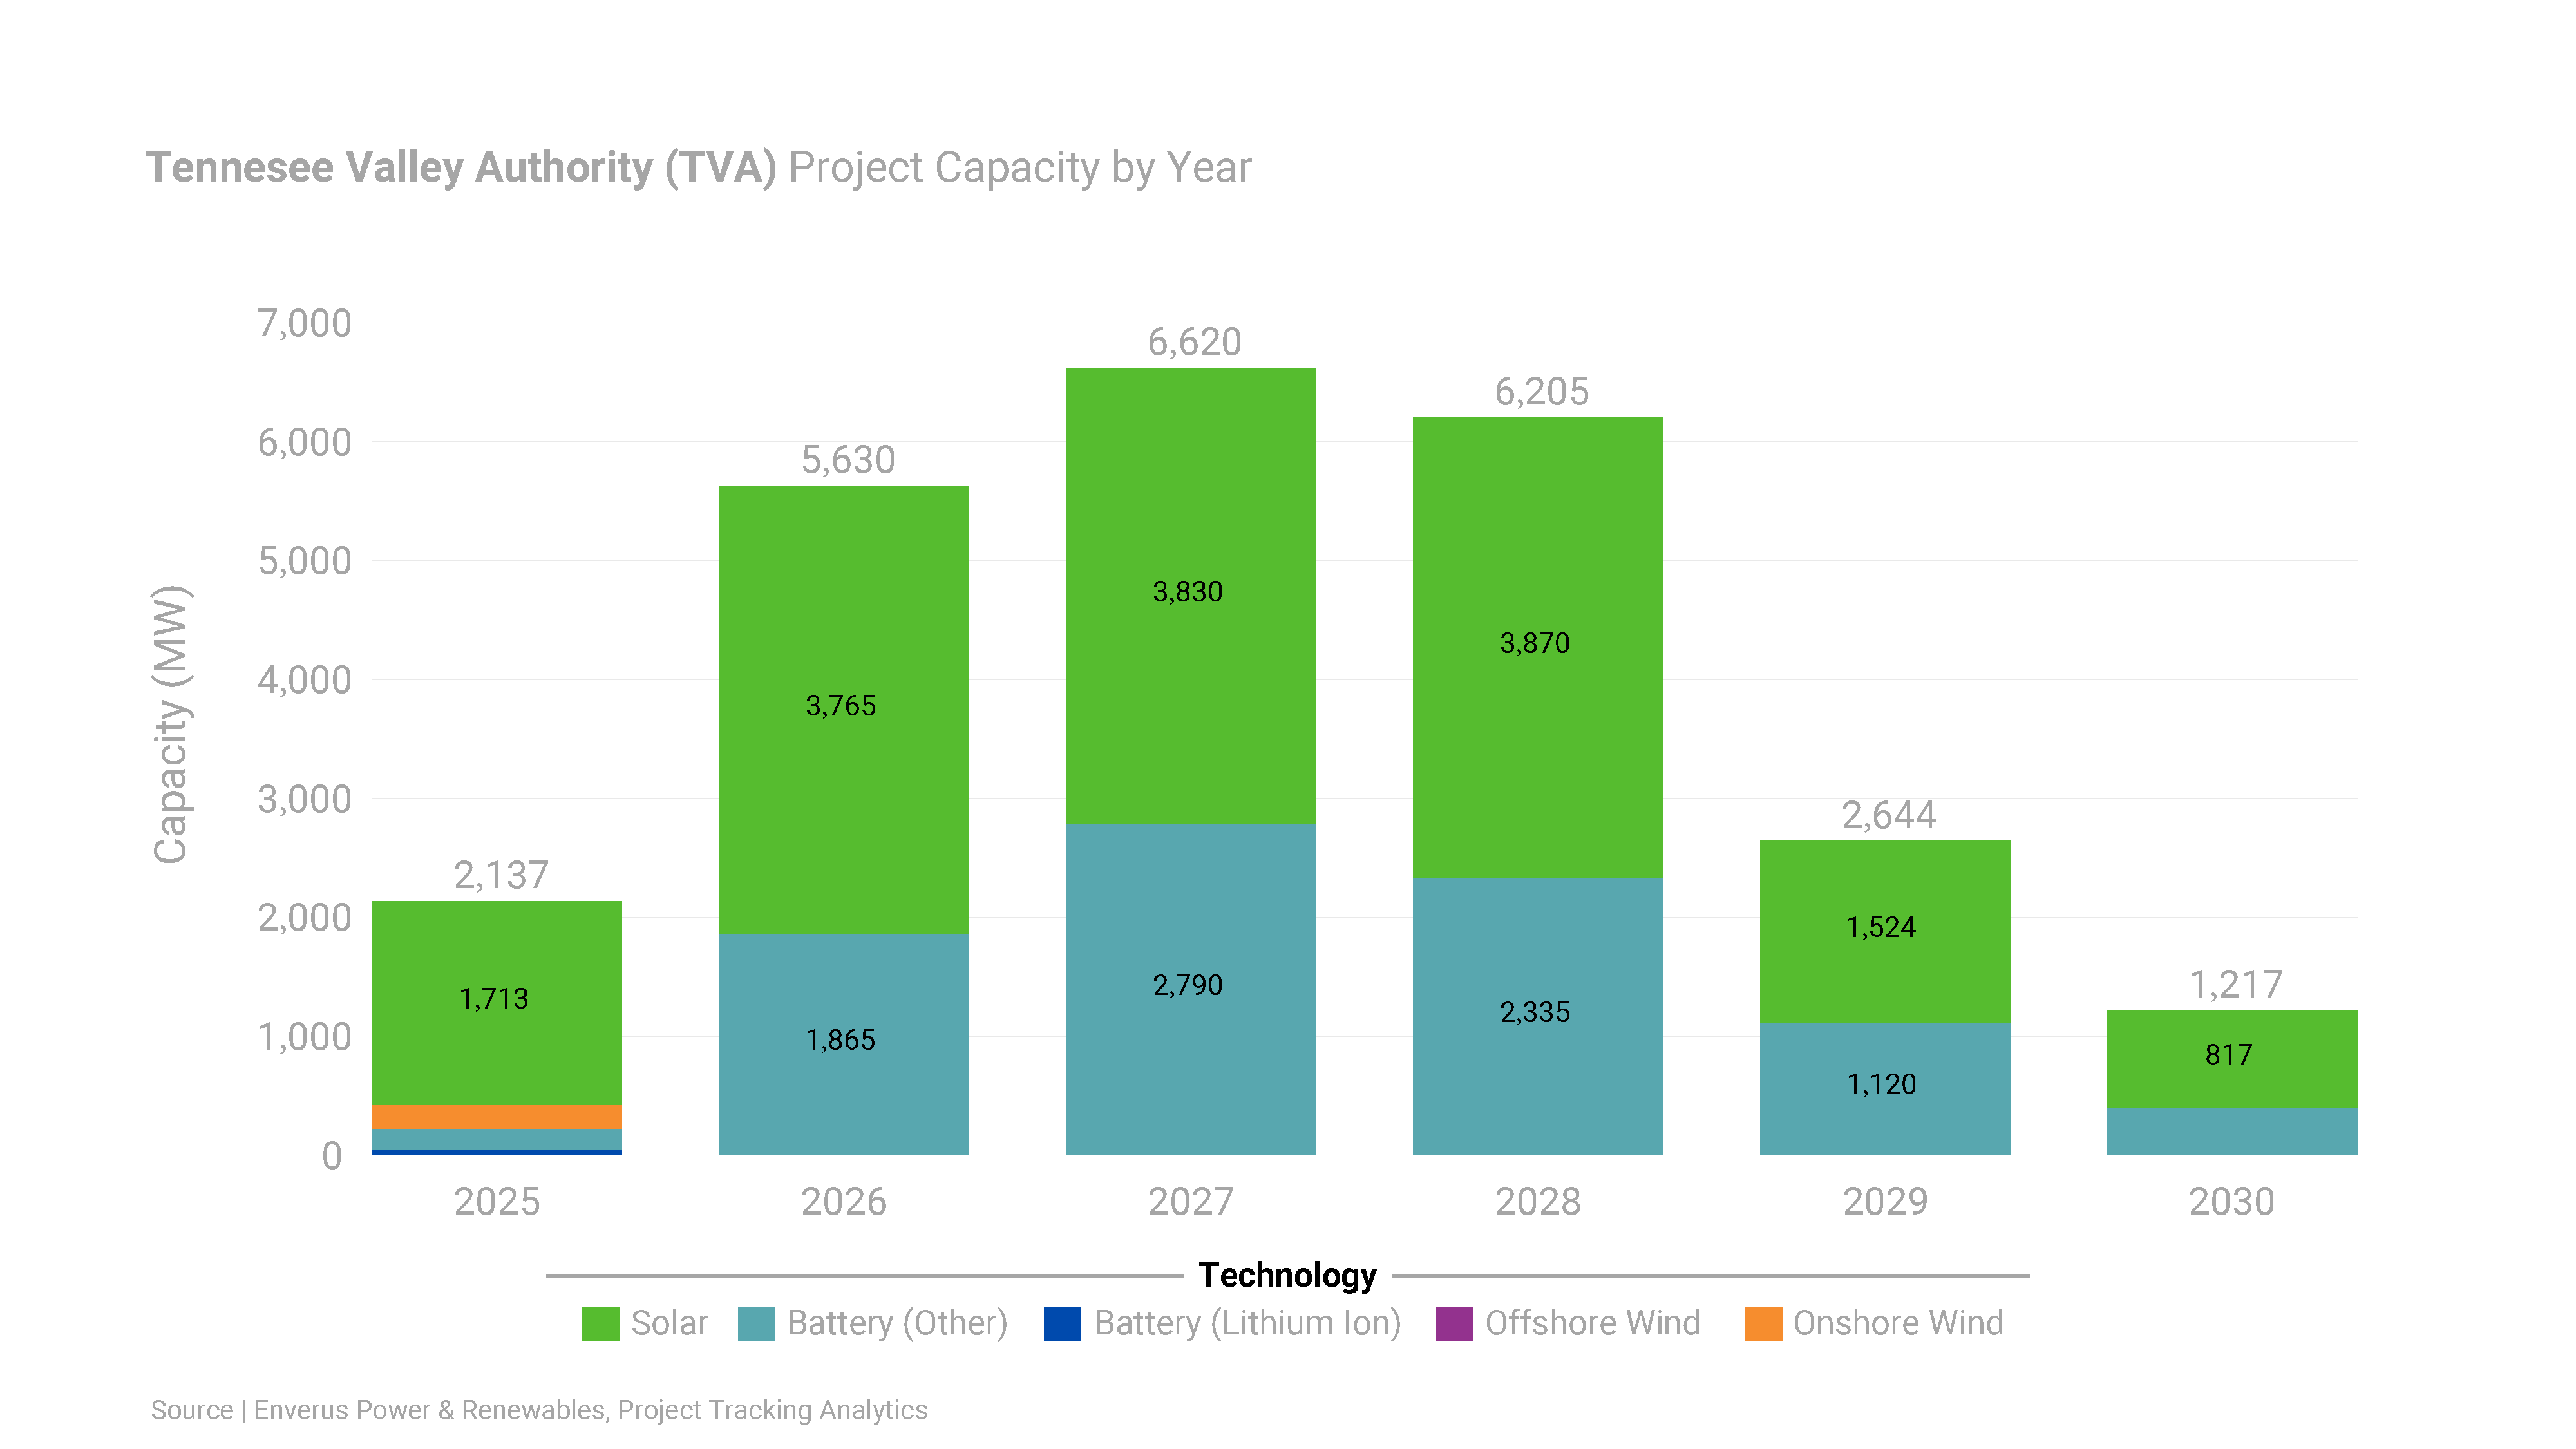
| Type | 2025 Planned Capacity |
|---|---|
| Solar | 1.71 GW |
| Wind | 0.20 GW |
| Storage | 0.22 GW |
Displaying only 2025 planned capacity due to the recent integration of utility queues in PRISM, ensuring maximum accuracy.
Dominate the day-ahead and real-time power markets with the most comprehensive short-term power solutions.
Quickly identify grid opportunities and risks with high-quality mid-term forecasts, expert analysis and streamlined grid analysis.
Confidently shape your investment strategy, identify optimal power asset locations and optimize utility scale PV project profitability—all in minutes.
Arm yourself with the knowledge to inform strategic decisions and grow your business with one source for insights across oil and gas, renewables, carbon capture and ESG.
Unlock returns of electron and molecule-based energy transition technologies with deal insights, from power generation assets to CCUS and hydrogen.
Tune out the noise, get unbiased evaluations and uncover hidden opportunities with advice you can trust from experienced energy and power intelligence advisors.
Discover
About Enverus
Resources
Follow Us
© Copyright 2025 All data and information are provided “as is”.